Gráficos de Gantt para Gestão de Produto
Planeje lançamentos de produtos, rollouts de funcionalidades e o planejamento de sprints com gráficos de Gantt criados para equipes de produto.
Utilizado por mais de 25.000 equipes em todo o mundo
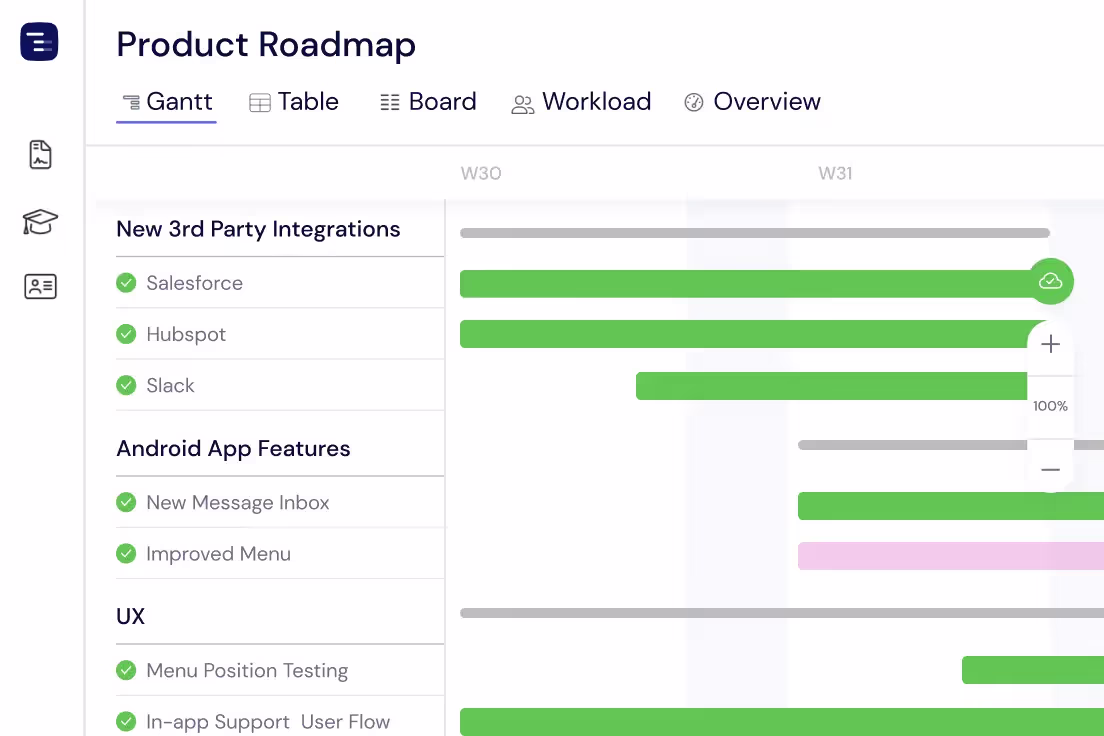
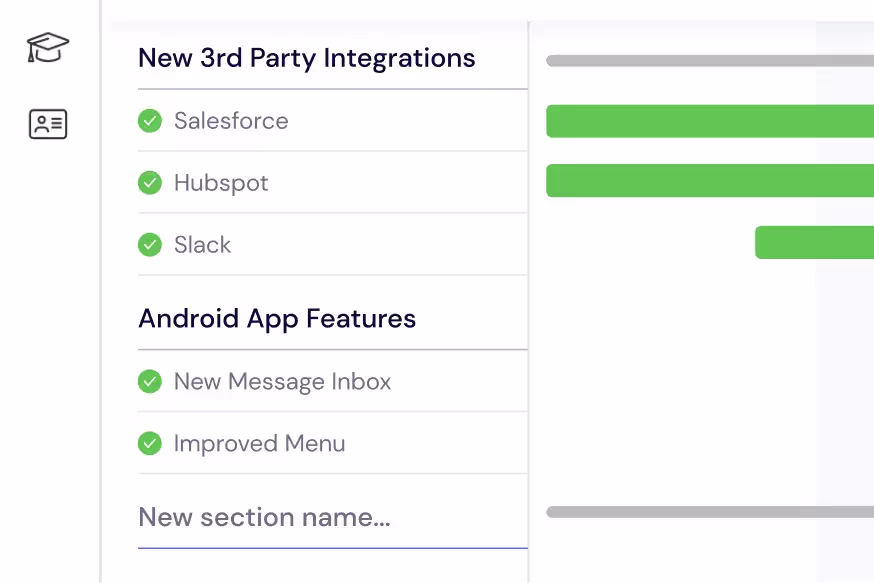
Planeje suas Tarefas
Divida seus projetos em tarefas e subtarefas gerenciáveis. Crie seções para organizar cada estágio do seu projeto e detalhar cada etapa do caminho.
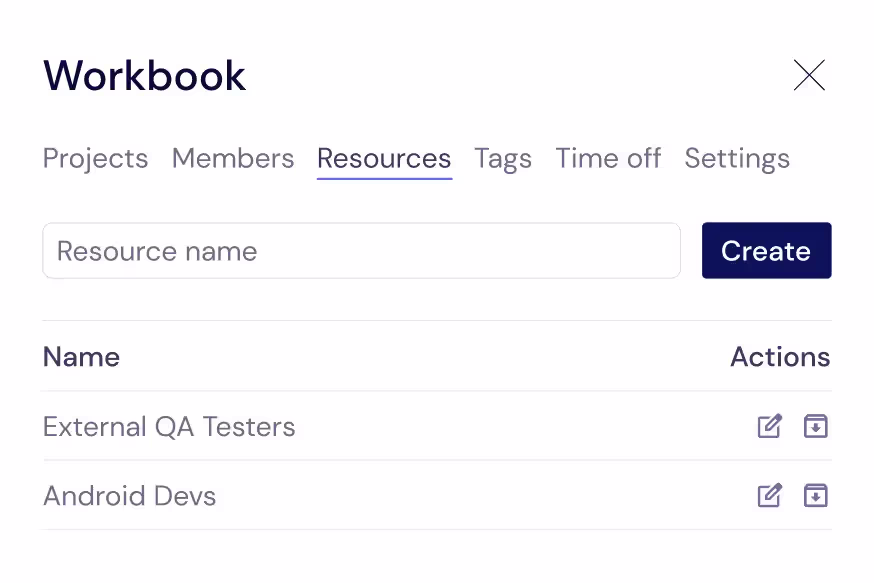
Gerencie sua Equipe e Recursos
Além dos membros da sua equipe, adicione quaisquer recursos\u2014internos ou externos\u2014que sejam essenciais para o sucesso do seu projeto. Isso pode incluir pessoas, equipamentos ou até mesmo equipes externas inteiras.
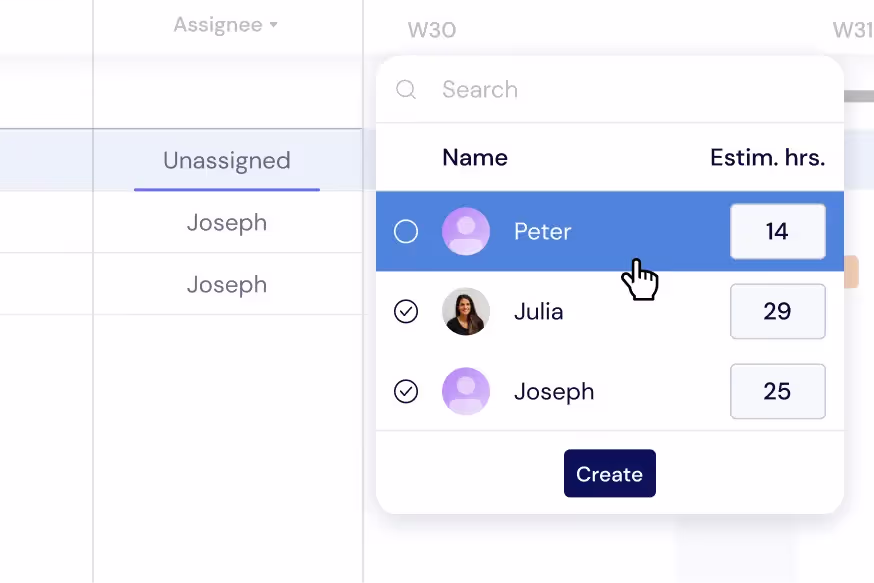
Distribua Tarefas e Carga de Trabalho
Atribua tarefas à sua equipe e garanta uma carga de trabalho equilibrada. Monitore as cargas de trabalho diretamente no seu Gráfico de Gantt ou use a Visualização de Carga de Trabalho para otimizar a alocação de recursos.
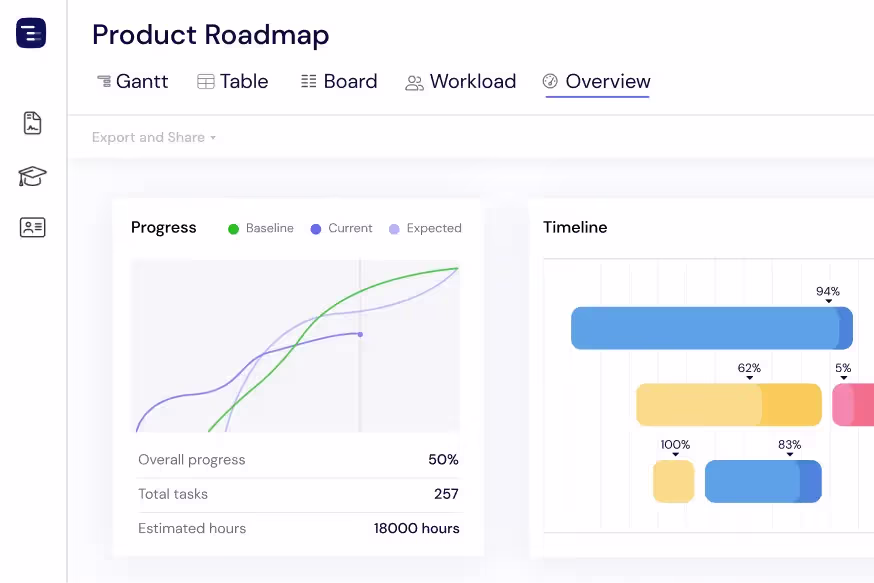
Tenha uma Visão Geral do Projeto
Mantenha-se atualizado com o cronograma do seu projeto usando a Visualização de Visão Geral. Monitore o progresso, cronogramas e cargas de trabalho em um relance, sem se perder nos detalhes. Alterne entre visualizações como Gantt, Tabela ou Quadro para informações específicas.
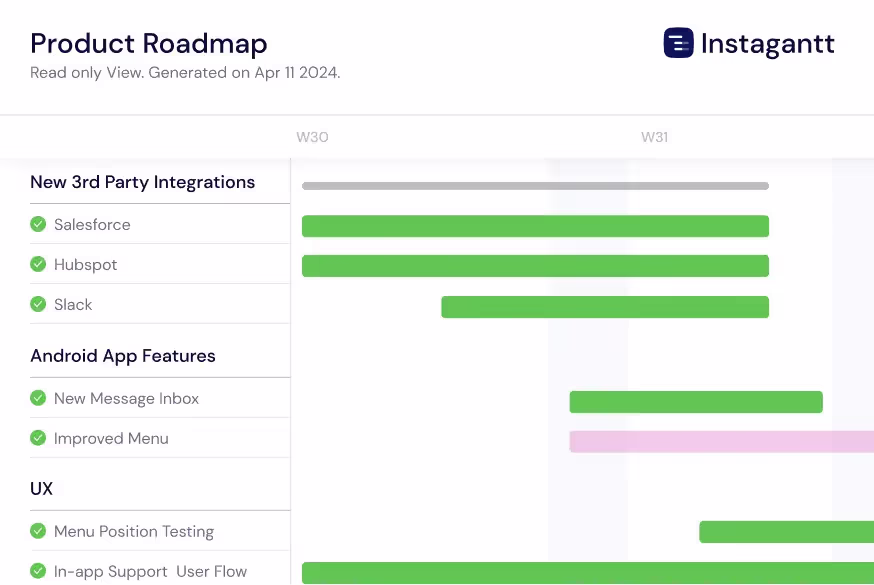
Compartilhe o Progresso com os Stakeholders
Obtenha vários formatos de exportação como PDF, PNG e Planilhas, prontos para serem compartilhados com membros da equipe, stakeholders e clientes. Use nosso recurso de Snapshot Público para dar aos stakeholders uma visão apenas de leitura do seu Gráfico de Gantt no Instagantt.
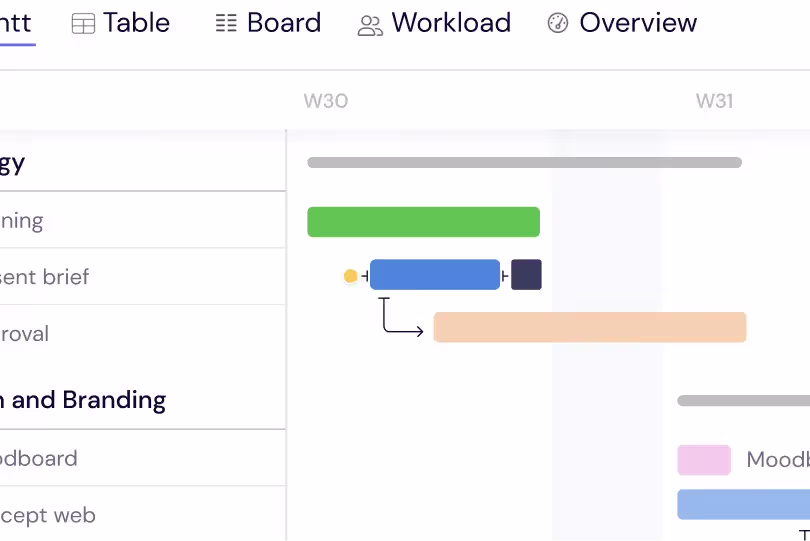
Track Dependencies Across Teams
Map cross-functional dependencies between product, engineering, design, marketing, and sales teams on a single timeline. When the design team needs an extra week for user research, see the immediate impact on engineering timelines and launch dates. Dependency visualization helps product managers coordinate the many moving parts of a product release and prevents the surprises that come from managing each team's timeline in isolation. Critical path highlighting shows which dependencies directly impact your launch date so you can focus attention where it matters most.
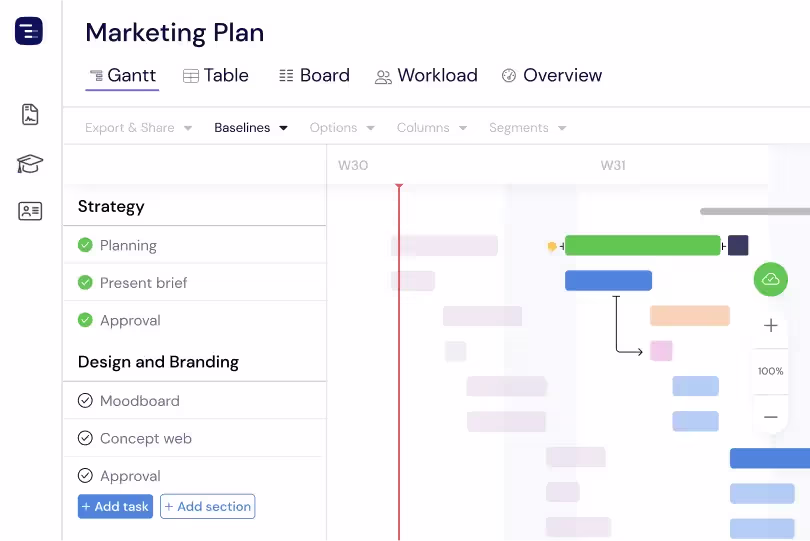
Compare Plans with Baselines
Create baseline snapshots of your product roadmap at any point in time — quarterly planning, board presentations, or sprint boundaries — and compare the original plan against actual progress side by side. Baselines make schedule drift visible and quantifiable. See which features started late, which are taking longer than estimated, and how the overall timeline has shifted since the plan was approved. This plan-versus-actual comparison is essential for product teams that want to improve their estimating accuracy, demonstrate progress to leadership, and communicate schedule changes with full transparency.
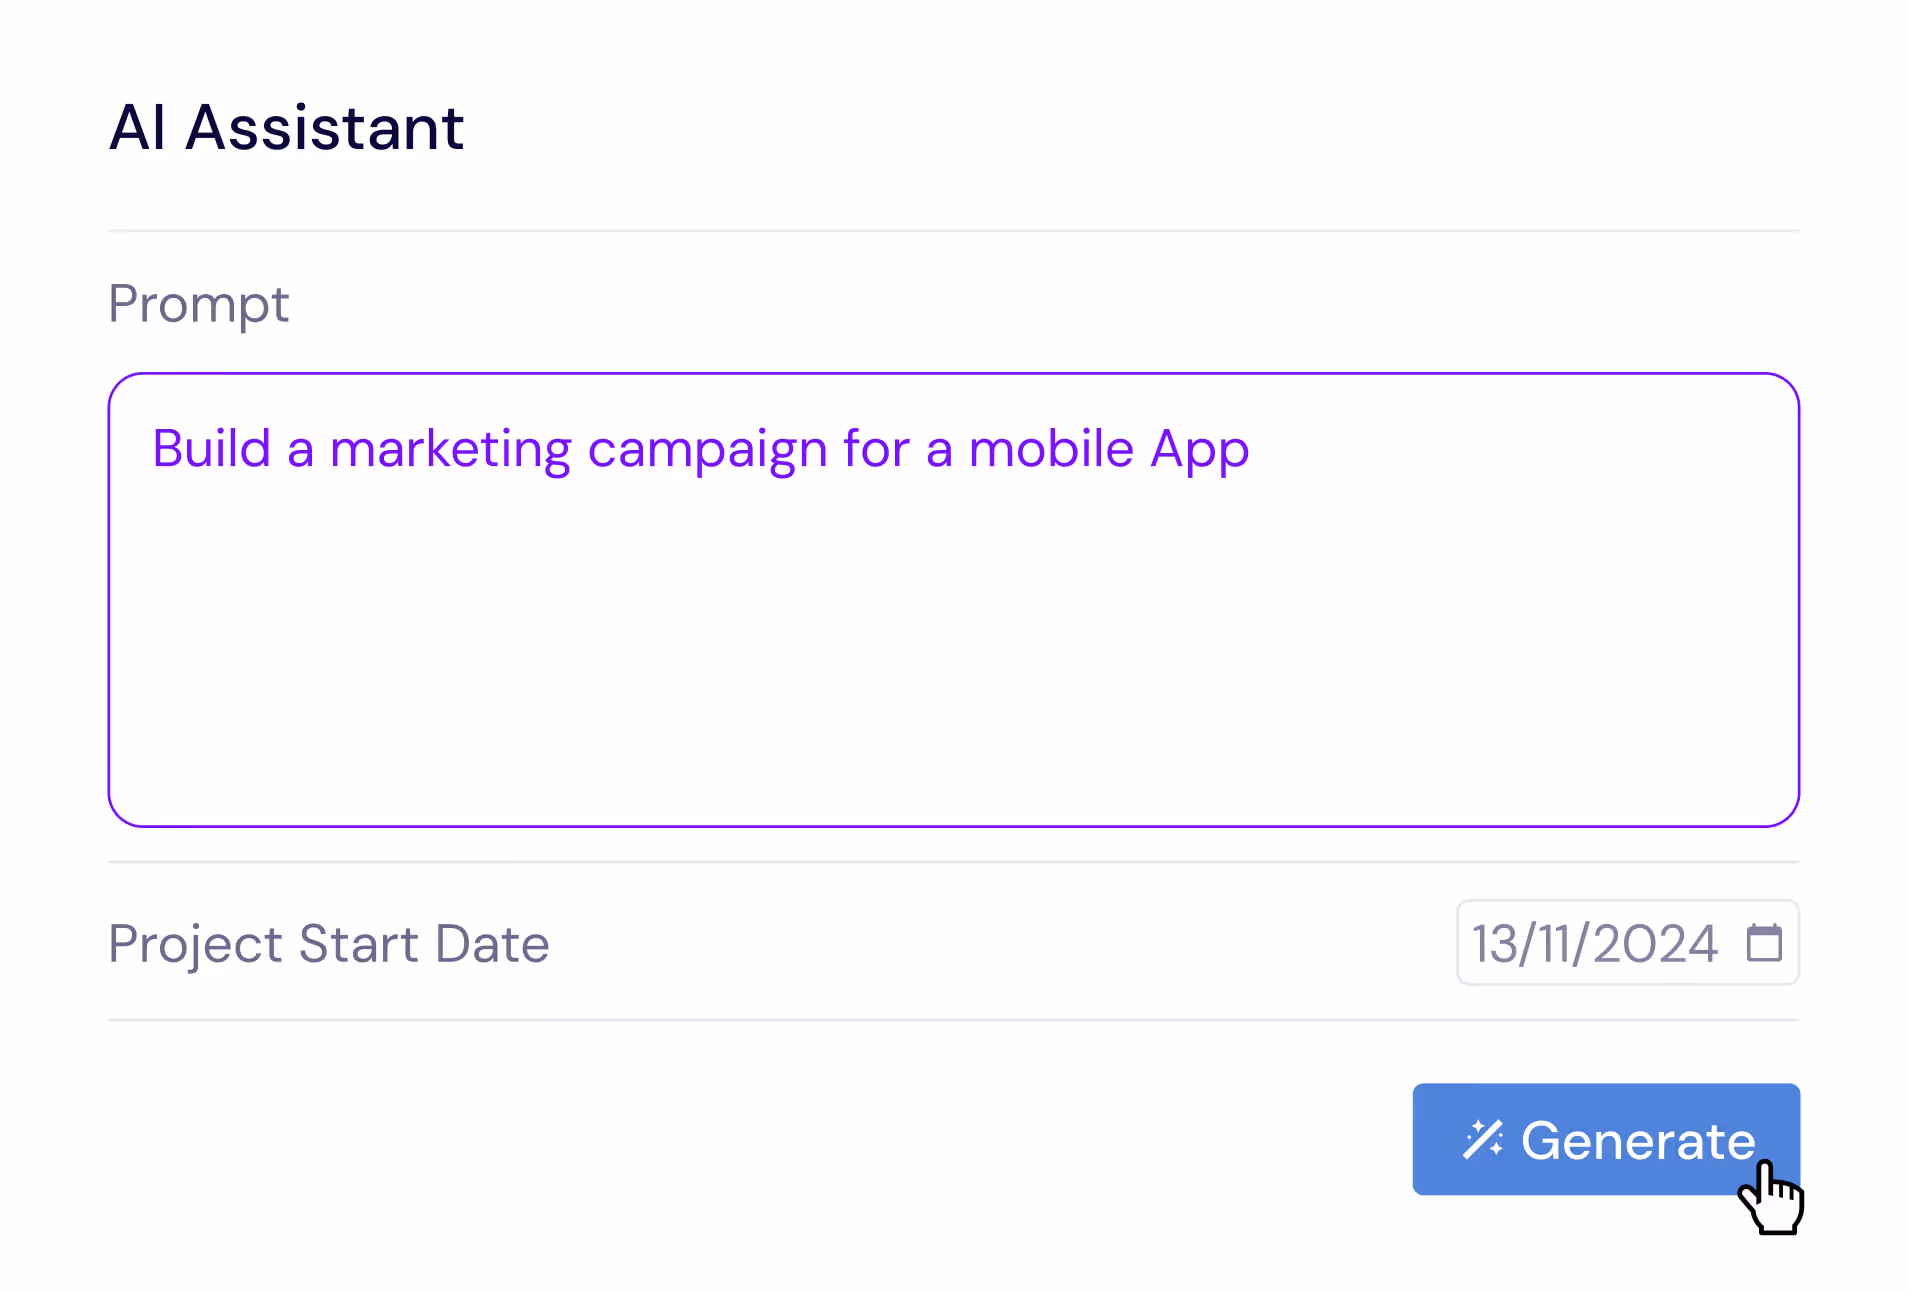
AI-Powered Project Creation
Describe your product initiative in plain English and let the AI Assistant generate a complete project plan with tasks, subtasks, estimated durations, and dependencies. Say something like 'Plan a mobile app feature release with design, iOS development, Android development, QA testing, and app store submission phases' and receive a professional project structure in seconds. Refine the generated plan with follow-up prompts, then save it as a template for future feature releases. The AI understands product management concepts like phased rollouts, feature flags, and beta testing stages.
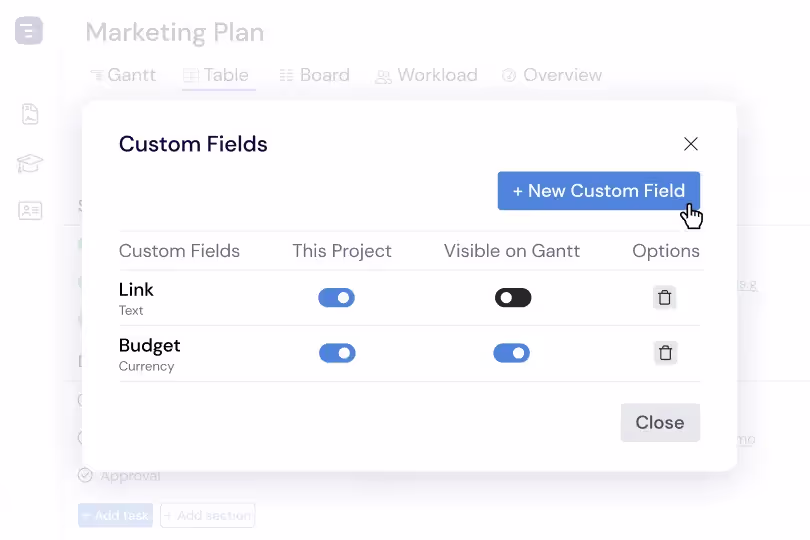
Custom Fields for Product Data
Add custom fields to capture the data dimensions that product managers care about — customer impact score, strategic priority, effort estimate, engineering complexity, target persona, and OKR alignment. Custom fields appear in the Table View as sortable, filterable columns, making it easy to analyze your product backlog from multiple angles. Sort by customer impact to prioritize high-value features, filter by target persona to see a specific audience's roadmap, or group by strategic theme to ensure balanced investment across product areas.
Coordinate Product Launches
Bring every function involved in a product launch onto a single timeline — engineering feature completion, design asset delivery, marketing campaign preparation, sales enablement training, documentation updates, and customer support readiness. Map dependencies between teams so engineering delays automatically surface their impact on marketing launch dates and sales training schedules. This cross-functional launch coordination prevents the common problem of marketing launching campaigns for features that are not yet ready, and ensures that sales teams are trained on new capabilities before customers start asking questions about them.
Manage Your Product Backlog
Organize and prioritize your product backlog with custom fields for effort, impact, customer request count, strategic alignment, and technical complexity. Sort and filter to surface the highest-value items, then drag them onto your roadmap timeline when they are ready to be scheduled. Unscheduled backlog items stay organized in a dedicated section without cluttering your active roadmap view. This backlog management approach bridges the gap between product strategy and execution by making it easy to move items from initial ideation and customer research through planning, development, and delivery on a visual timeline.
Multiple Views for Different Audiences
Switch between Gantt, Table, Board, and Overview views depending on your audience and the information you need to communicate. Use the Gantt chart for detailed timeline planning with dependencies, the Table View for data analysis and filtering, the Kanban Board for sprint execution tracking, and the Overview for portfolio-level status reporting. Each view shows the same underlying data from a different perspective, so product managers can tailor their communication to technical teams, executives, and stakeholders without maintaining separate documents or presentations.