Gráficos de Gantt para Desenvolvimento de Software
Visualize seu pipeline de desenvolvimento, do planejamento ao deploy. Acompanhe sprints, gerencie lançamentos e coordene dependências entre equipes.
Utilizado por mais de 25.000 equipes em todo o mundo
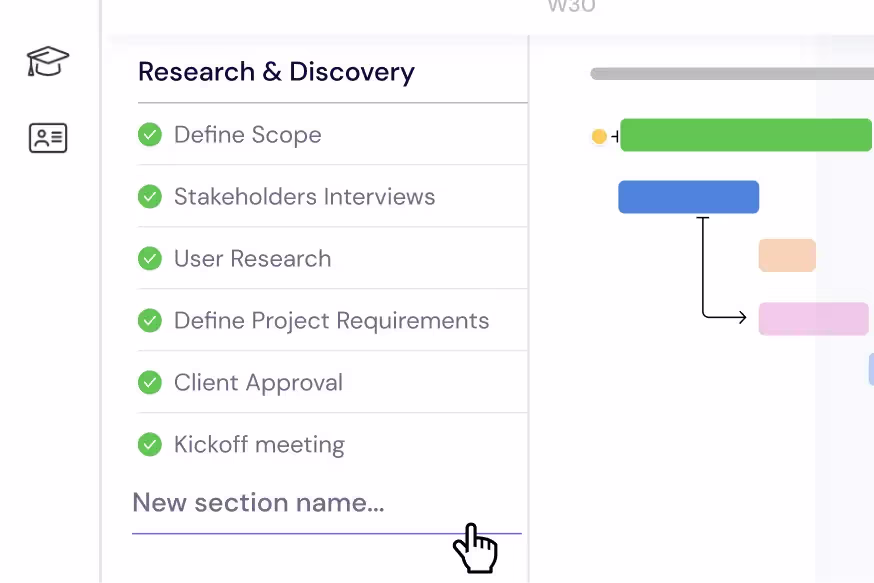
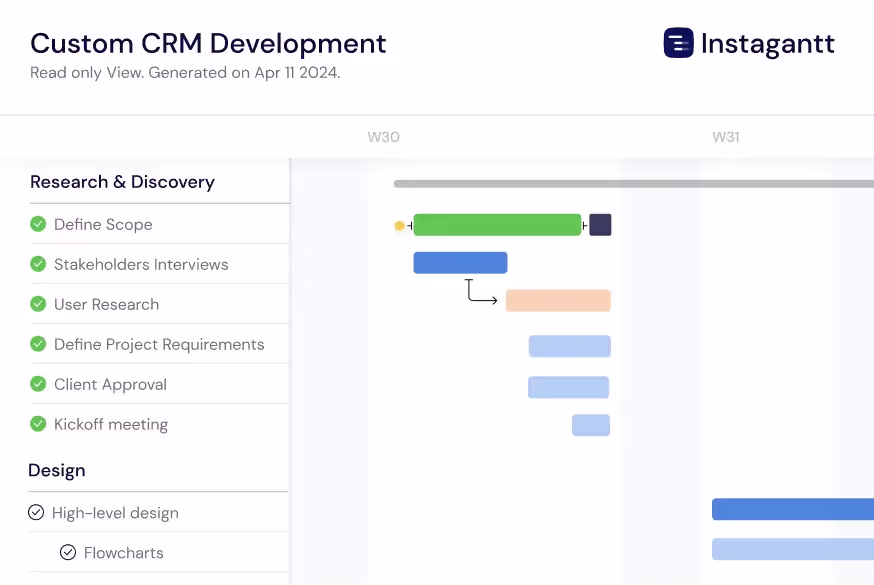
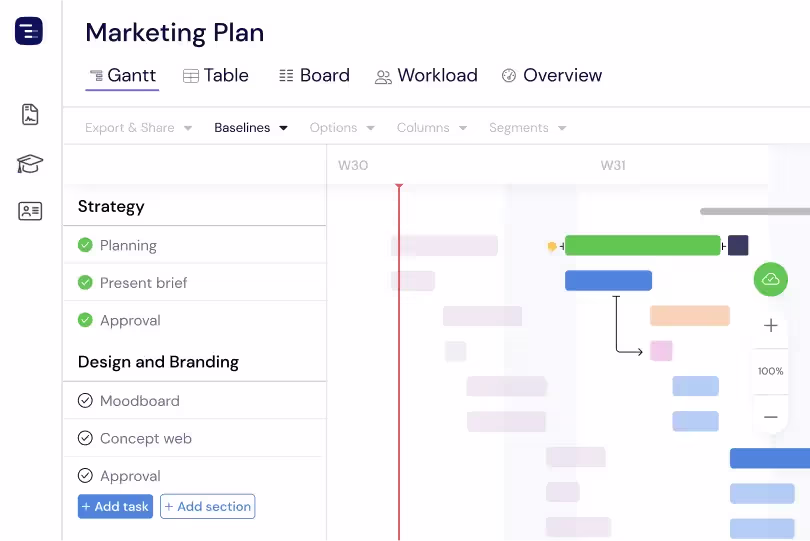
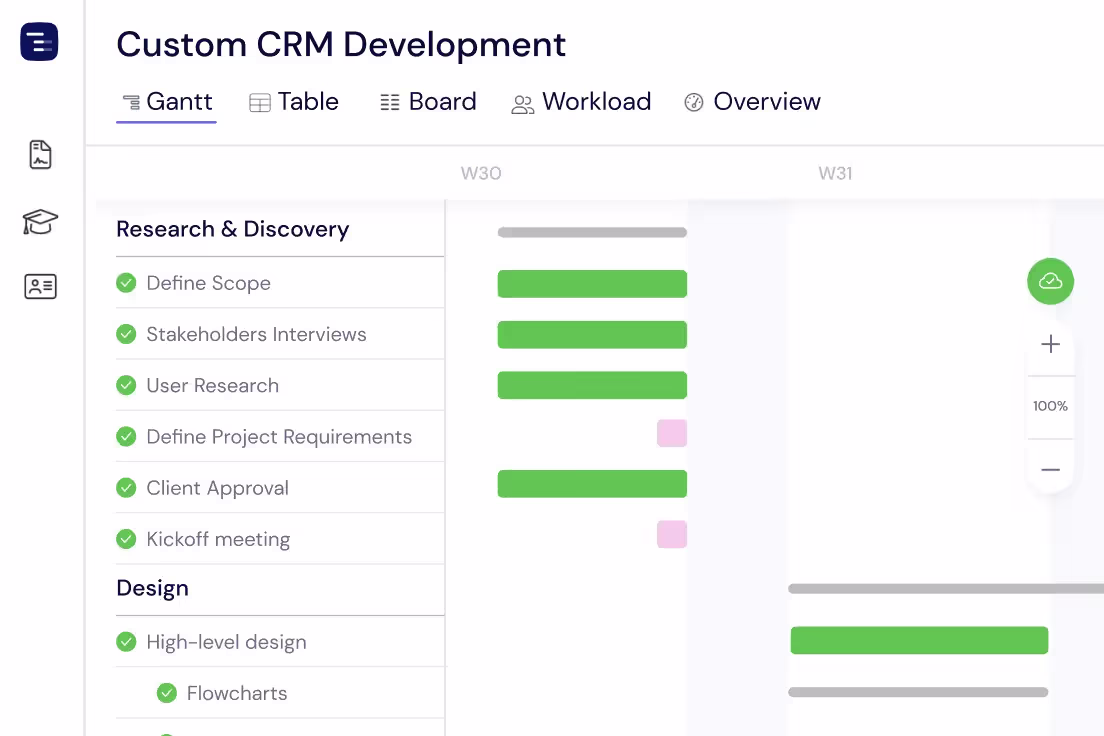
Planeje Sprints e Lançamentos
Divida seu roadmap em épicos, user stories e sub-tarefas. Organize cada ciclo de lançamento — do planejamento de recursos ao code freeze — em seções claras com prazos, dependências e marcos em seu gráfico de Gantt.
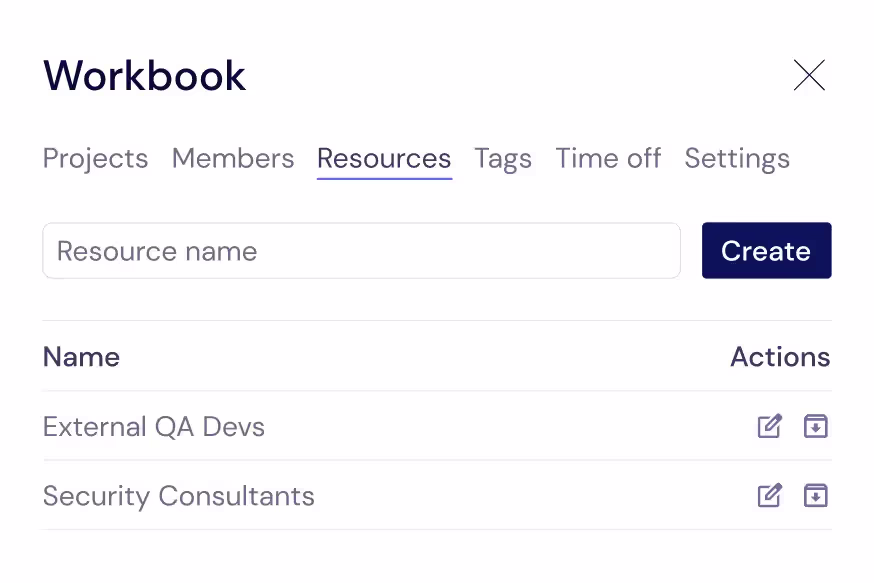
Gerencie sua Equipe de Engenharia
Acompanhe cada contribuidor que mantém sua base de código em movimento — desenvolvedores, engenheiros de QA, designers e contratados externos. Atribua-os a tarefas para saber sempre quem está trabalhando em quê e quando estão disponíveis.
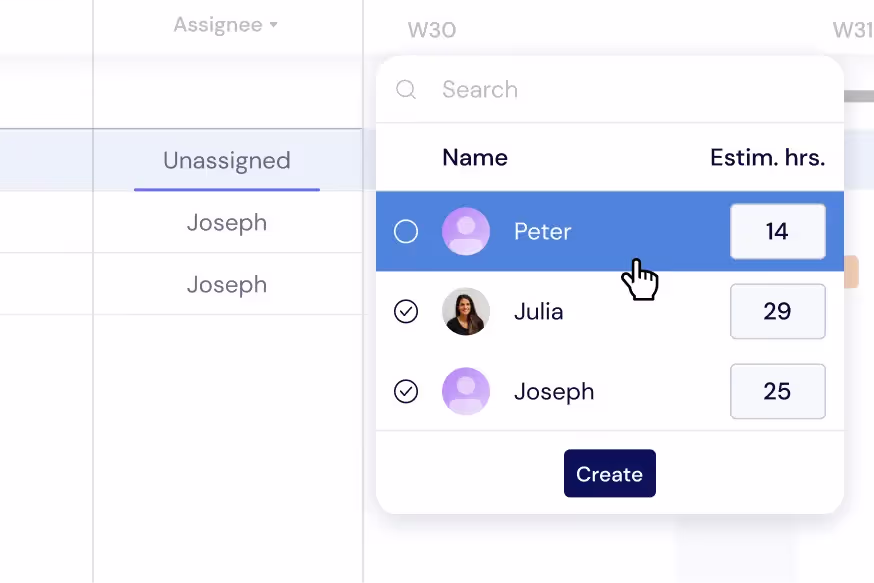
Equilibre a Carga de Trabalho dos Desenvolvedores
Distribua tarefas entre sua equipe de engenharia para evitar burnout e prazos perdidos. Monitore cargas de trabalho individuais diretamente no seu gráfico de Gantt ou mude para a Visualização de Carga de Trabalho para reequilibrar as atribuições de sprint em tempo real.
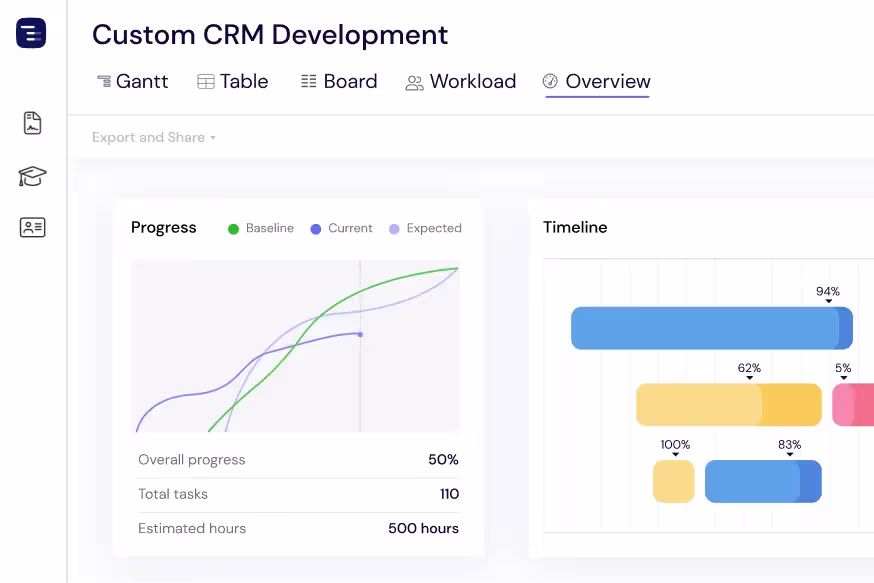
Obtenha uma Visão Geral de Vários Projetos
Veja todos os projetos e lançamentos ativos rapidamente com a Visualização Geral. Monitore o progresso do sprint, prazos próximos e a capacidade da equipe sem se perder nos detalhes. Alterne entre as visualizações de Gantt, Tabela ou Quadro conforme necessário.
Compartilhe Atualizações com Stakeholders
Exporte cronogramas de lançamento como PDF, PNG ou Planilhas para compartilhar com donos de produtos, executivos e clientes. Use Snapshots Públicos para dar aos stakeholders uma visualização ao vivo e somente leitura do seu cronograma de desenvolvimento no Instagantt.
Track Technical Debt and Bug Fixes
Manage technical debt reduction and critical bug fixes alongside feature development on the same timeline. Create dedicated sections for tech debt sprints, security patches, and performance improvements so engineering managers can visualize the balance between new features and maintenance work. Link bug resolution to release milestones with dependencies to ensure release-blocking bugs are resolved before deployment. This unified view helps engineering leaders communicate to stakeholders why technical investment is necessary and how it fits within the overall release schedule.
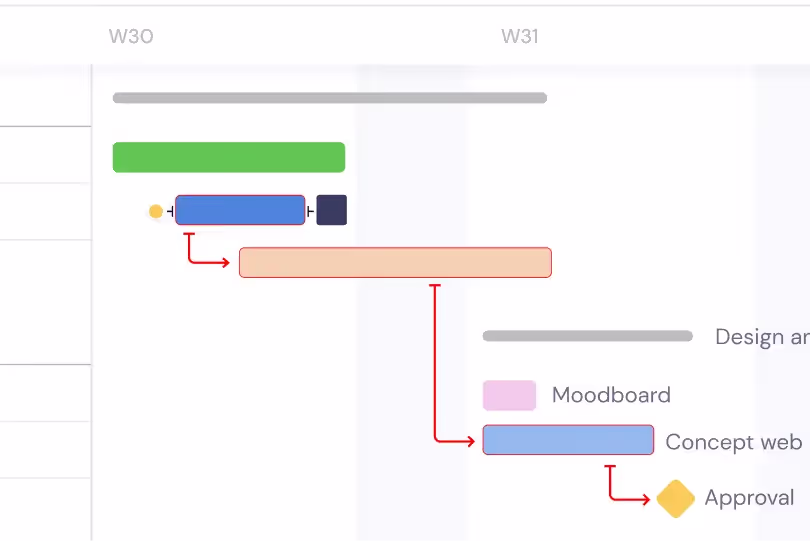
Visualize the Critical Path
Enable critical path highlighting to see which chain of dependent tasks determines your release date. The critical path reveals the minimum time needed to deliver your release and identifies exactly which tasks cannot slip without delaying the entire release. Focus engineering effort on critical path tasks during crunch time, and use the critical path analysis to make informed decisions about scope cuts, timeline extensions, or additional resourcing. Understanding the critical path transforms release planning from guesswork into data-driven decision making.
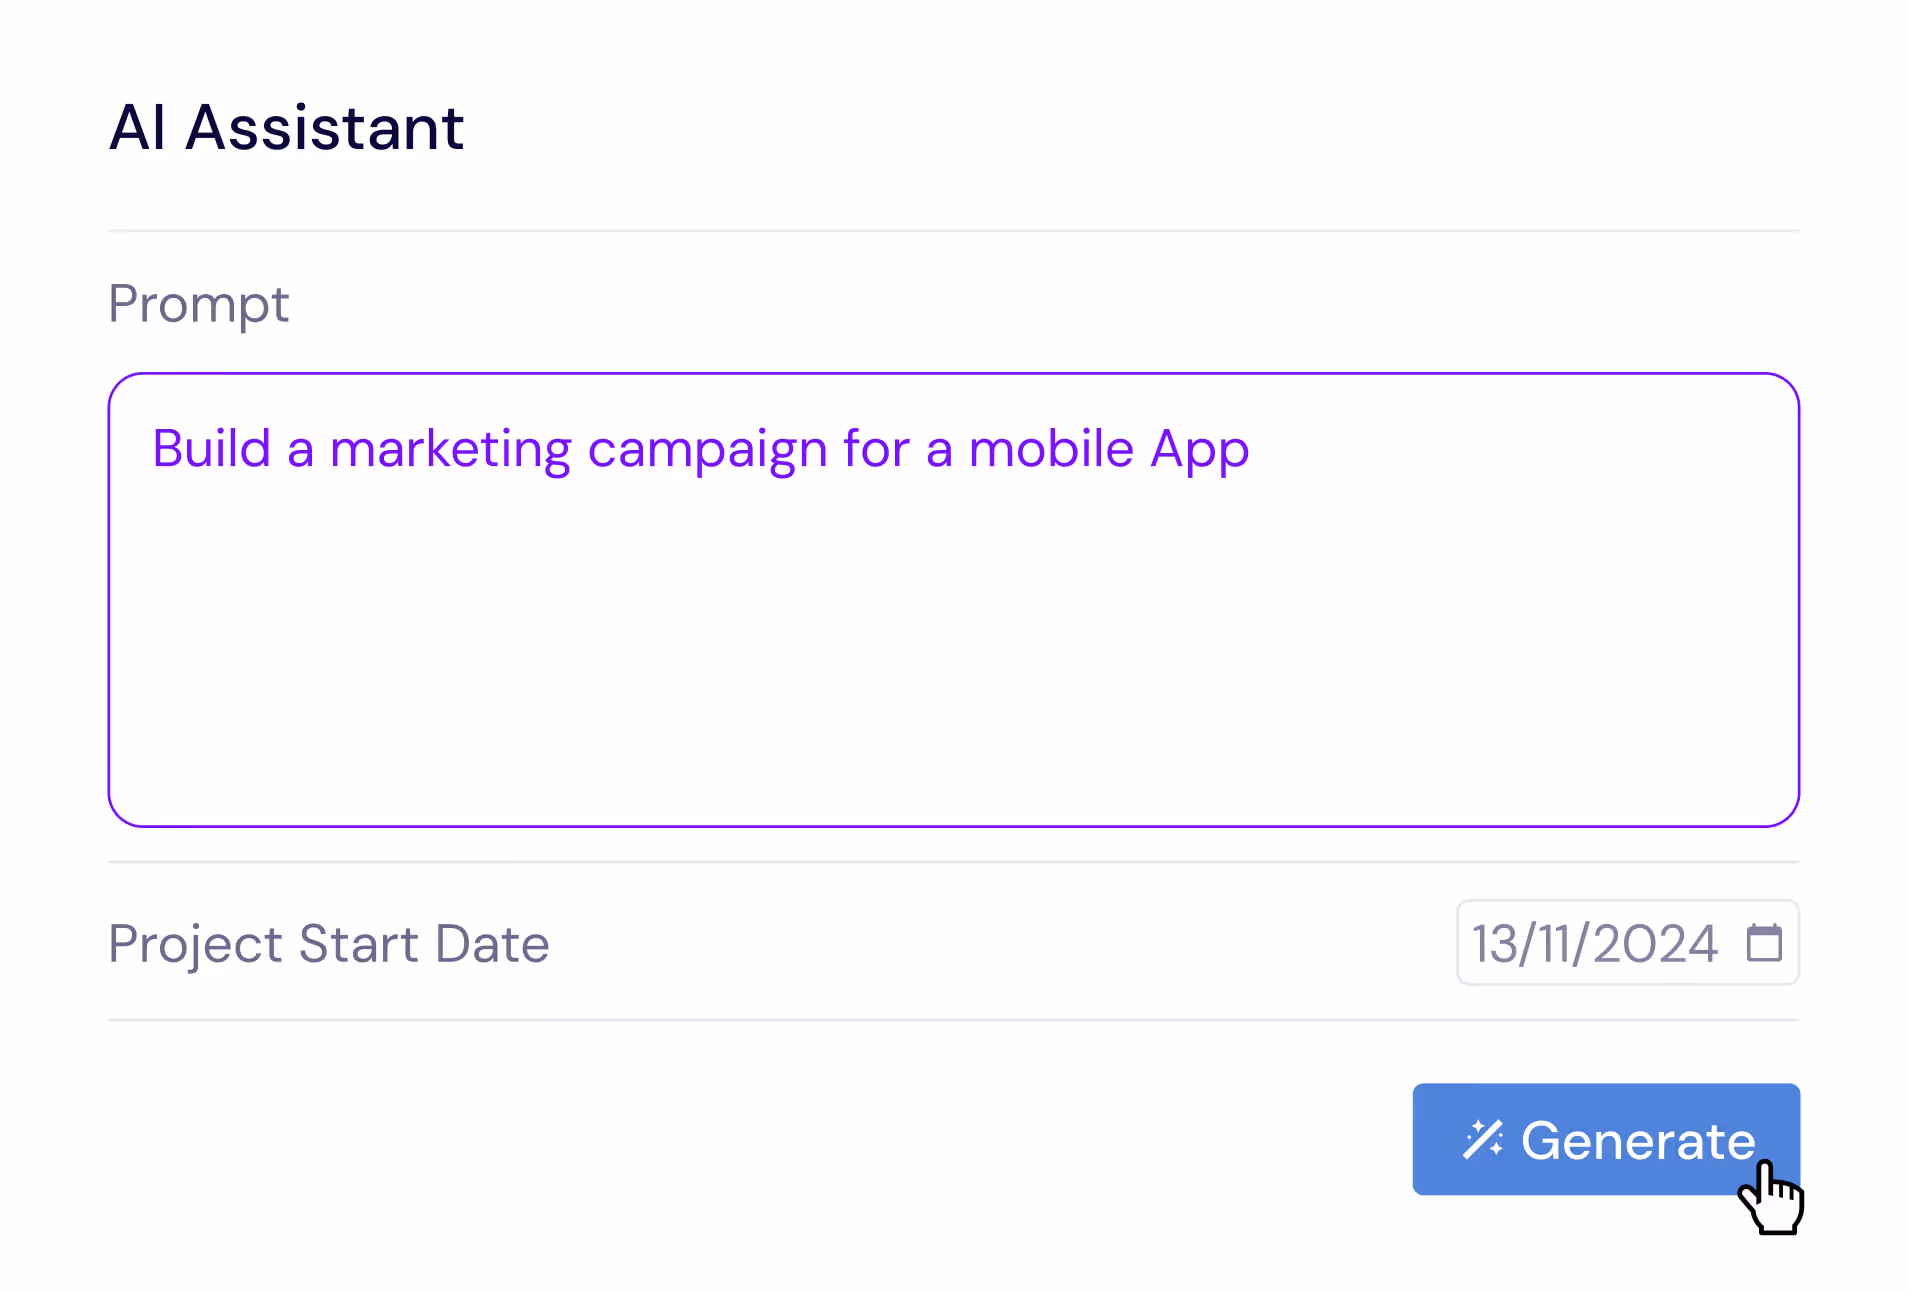
AI-Powered Sprint Planning
Describe your release in plain English and let the AI Assistant generate a complete project plan with epics, user stories, subtasks, estimated durations, and dependencies. Say something like 'Plan a SaaS feature release with API design, frontend development, backend development, integration testing, and staged rollout phases' and receive a professional release structure in seconds. Refine the generated plan with follow-up prompts, then save it as a template for future releases. The AI understands software development concepts like code reviews, staging environments, and feature flag rollouts.
Compare Releases with Baselines
Create baseline snapshots of your release plan at sprint boundaries, planning milestones, or stakeholder checkpoints and compare the original plan against actual progress. Baselines are invaluable for retrospectives and estimation improvement. They help engineering managers quantify schedule drift — see which features took longer than estimated, which were added mid-cycle, and how the overall timeline shifted since the release was planned. This data improves future estimation accuracy and gives engineering leaders the evidence they need to push back on unrealistic scope additions or timeline compression.
Multiple Views for Engineering Teams
Switch between Gantt chart, Table View, Board View, and Overview depending on the context. Use the Gantt chart for release planning and cross-team dependency management, the Table View for detailed sprint data analysis, the Kanban Board for daily stand-up tracking and sprint execution, and the Overview for engineering leadership reporting. Each view shows the same project data from a different perspective. Engineering managers can present to executives using the Overview, plan sprints using the Gantt chart, and track daily progress using the Board — all from the same project without maintaining separate tools.
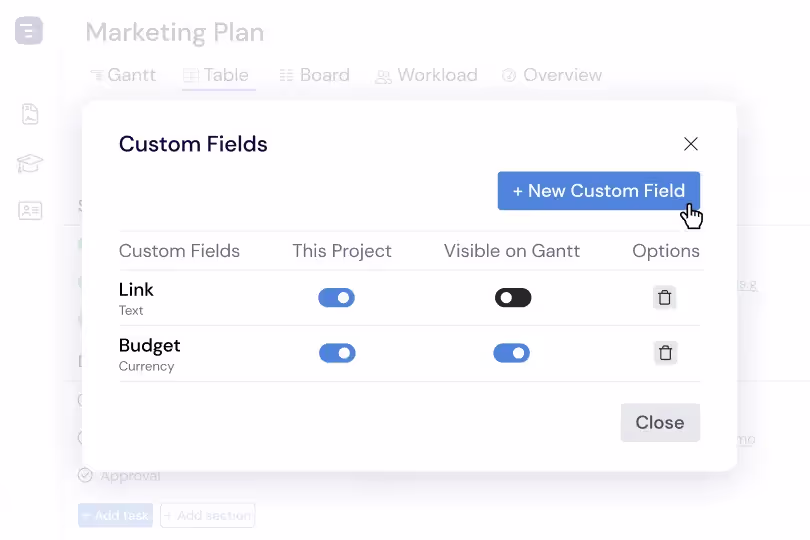
Custom Fields for Engineering Data
Add custom fields to capture engineering-specific data like story points, sprint velocity, code review status, deployment environment, feature flag state, and technical debt classification. Custom fields appear as sortable, filterable columns in the Table View, making it easy to analyze your engineering portfolio from multiple dimensions. Sort by story points to understand sprint capacity, filter by deployment status to track release readiness, or group by team to see workload distribution across engineering squads.