विनिर्माण के लिए गैंट चार्ट
विजुअल गैंट चार्ट समयसीमा के साथ उत्पादन रन की योजना बनाएं, आपूर्ति श्रृंखलाओं का प्रबंधन करें और विनिर्माण प्रक्रियाओं का समन्वय करें।
दुनिया भर में 25,000+ टीमों द्वारा भरोसेमंद
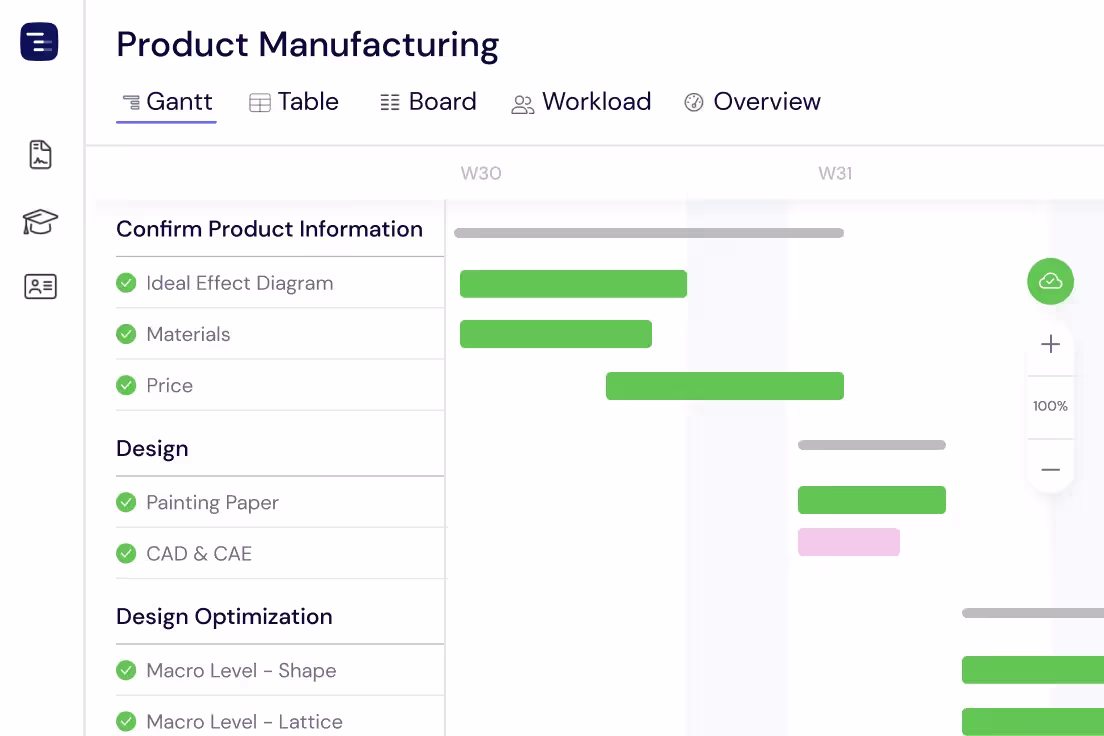
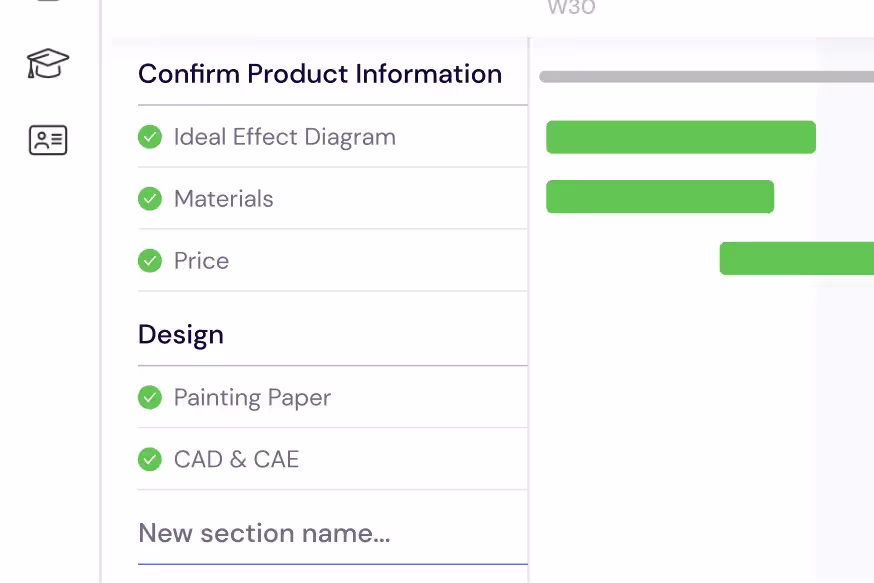
अपने उत्पादन कार्यों की योजना बनाएं
उत्पादन रन को प्रबंधनीय कार्यों और उप-कार्यों में विभाजित करें। अपने गैंट चार्ट पर समय सीमा, अवधि और निर्भरता के साथ कच्चे माल की खरीद से लेकर अंतिम असेंबली तक प्रत्येक चरण को स्पष्ट अनुभागों में व्यवस्थित करें।
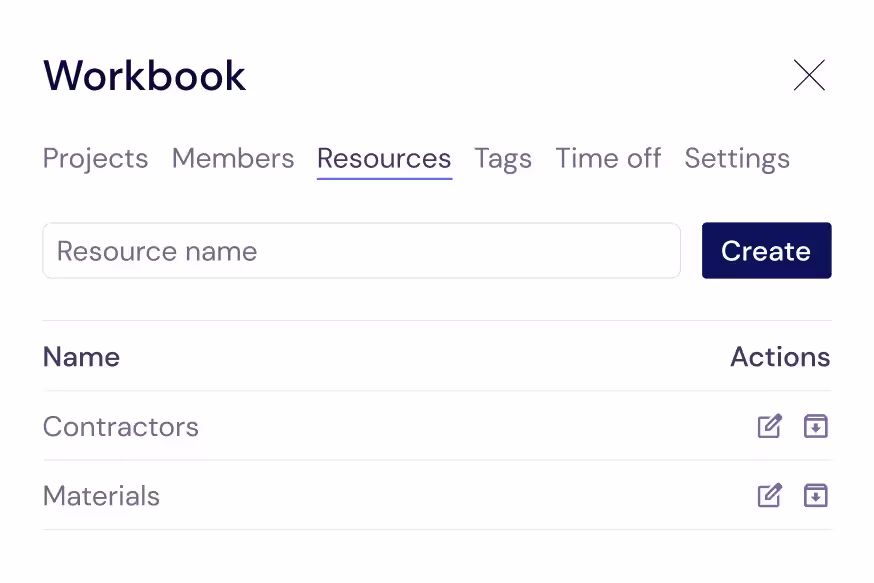
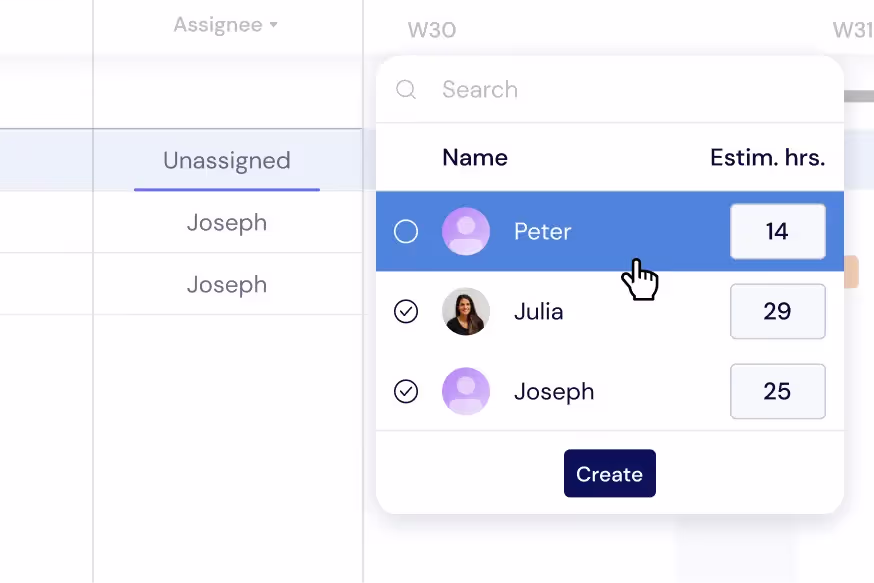
अपनी टीम और उपकरणों का प्रबंधन करें
टीम के सदस्यों से आगे बढ़ें और अपनी लाइन को चालू रखने वाले हर संसाधन - ऑपरेटर, मशीनें, ठेकेदार और बाहरी आपूर्तिकर्ता - को ट्रैक करें। उन्हें कार्यों के लिए असाइन करें ताकि आप हमेशा जान सकें कि कौन और क्या उपलब्ध है।
उत्पादन कार्यभार को संतुलित करें
बाधाओं को रोकने के लिए शिफ्टों और टीमों में कार्यों को वितरित करें। सीधे अपने गैंट चार्ट पर ऑपरेटर और मशीन कार्यभार की निगरानी करें या वास्तविक समय में आवंटन को पुन: संतुलित करने के लिए वर्कलोड व्यू पर स्विच करें।
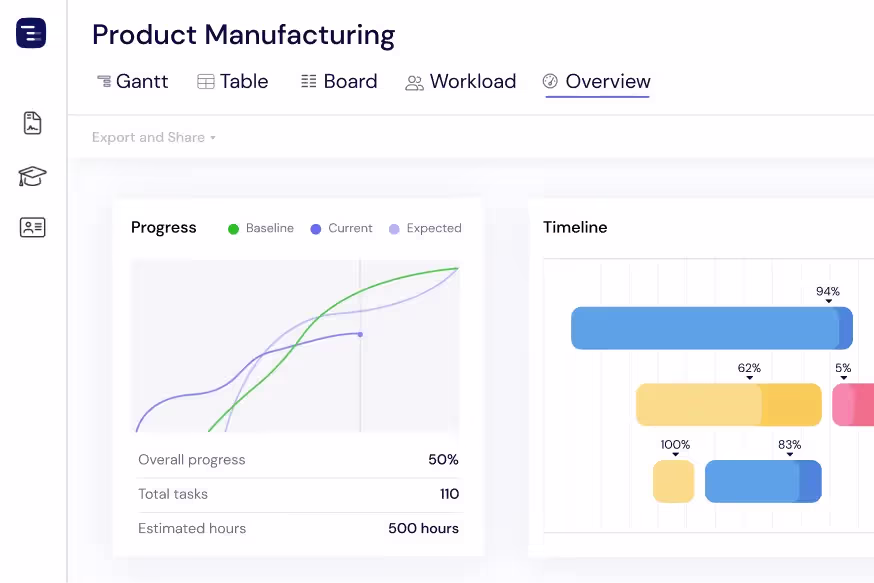
पूरे प्लांट का अवलोकन प्राप्त करें
ओवरव्यू व्यू के साथ एक नज़र में प्रत्येक उत्पादन लाइन और प्रोजेक्ट देखें। विवरणों में खोए बिना प्रगति, वितरण तिथियों और संसाधन उपयोग की निगरानी करें। अपनी आवश्यकतानुसार जानकारी के लिए गैंट, टेबल या बोर्ड व्यू के बीच स्विच करें।
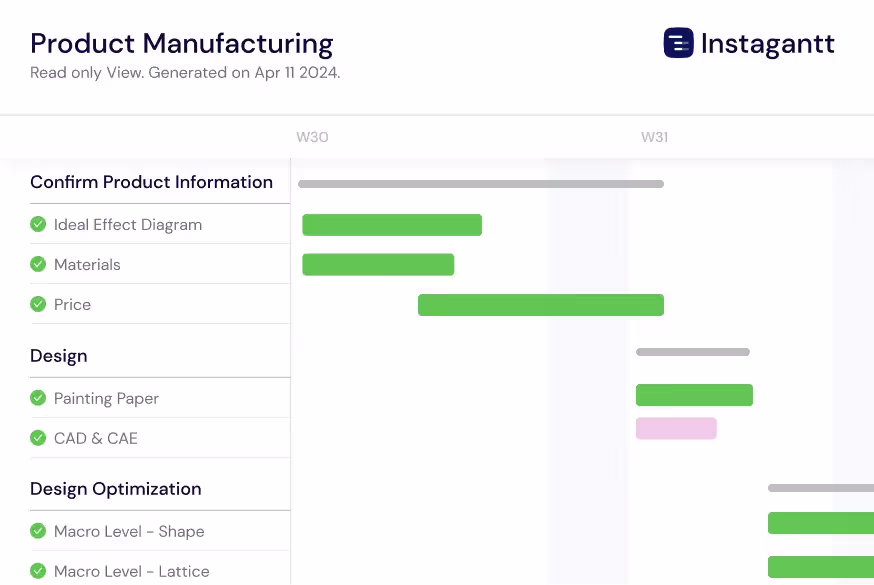
हितधारकों के साथ प्रगति साझा करें
प्लांट प्रबंधकों, ग्राहकों और आपूर्तिकर्ताओं के साथ साझा करने के लिए उत्पादन शेड्यूल को PDF, PNG या स्प्रेडशीट के रूप में निर्यात करें। हितधारकों को Instagantt पर आपकी विनिर्माण समयरेखा का लाइव, केवल-पठनीय दृश्य देने के लिए पब्लिक स्नैपशॉट का उपयोग करें।
Track Quality and Compliance Milestones
Set quality assurance checkpoints, regulatory inspections, and certification milestones throughout your production timeline. Connect QA gates to production phases with dependencies so downstream work cannot proceed until quality checks pass. Track ISO certification timelines, FDA compliance deadlines, and industry-specific regulatory requirements alongside your production schedule. When an inspection reveals a defect, immediately see the impact on downstream operations and delivery commitments. This proactive quality tracking helps manufacturing teams catch issues early, reduce rework costs, and maintain compliance with industry standards.
Coordinate Supply Chain Dependencies
Map your entire supply chain on the Gantt chart by linking material procurement, supplier deliveries, and inventory management to production tasks. See which materials are on order, which suppliers have confirmed delivery dates, and which raw materials are at risk of delay. When a supplier pushes back a delivery date, the production tasks that depend on that material automatically adjust, giving you an immediate view of the impact on your production schedule and customer commitments. This supply chain visibility helps procurement teams prioritize vendor follow-ups and identify alternative sourcing options before shortages halt production.
Plan Equipment Maintenance Windows
Schedule preventive maintenance, equipment calibration, and facility upgrades alongside your production runs to minimize unplanned downtime. Visualize maintenance windows on the same Gantt chart as production schedules so you can plan maintenance during natural breaks between production runs rather than interrupting active orders. Track maintenance dependencies — technician availability, spare parts procurement, and vendor service appointments — to ensure everything is ready when the maintenance window opens. Proactive maintenance planning reduces emergency repair costs and extends equipment lifespan.
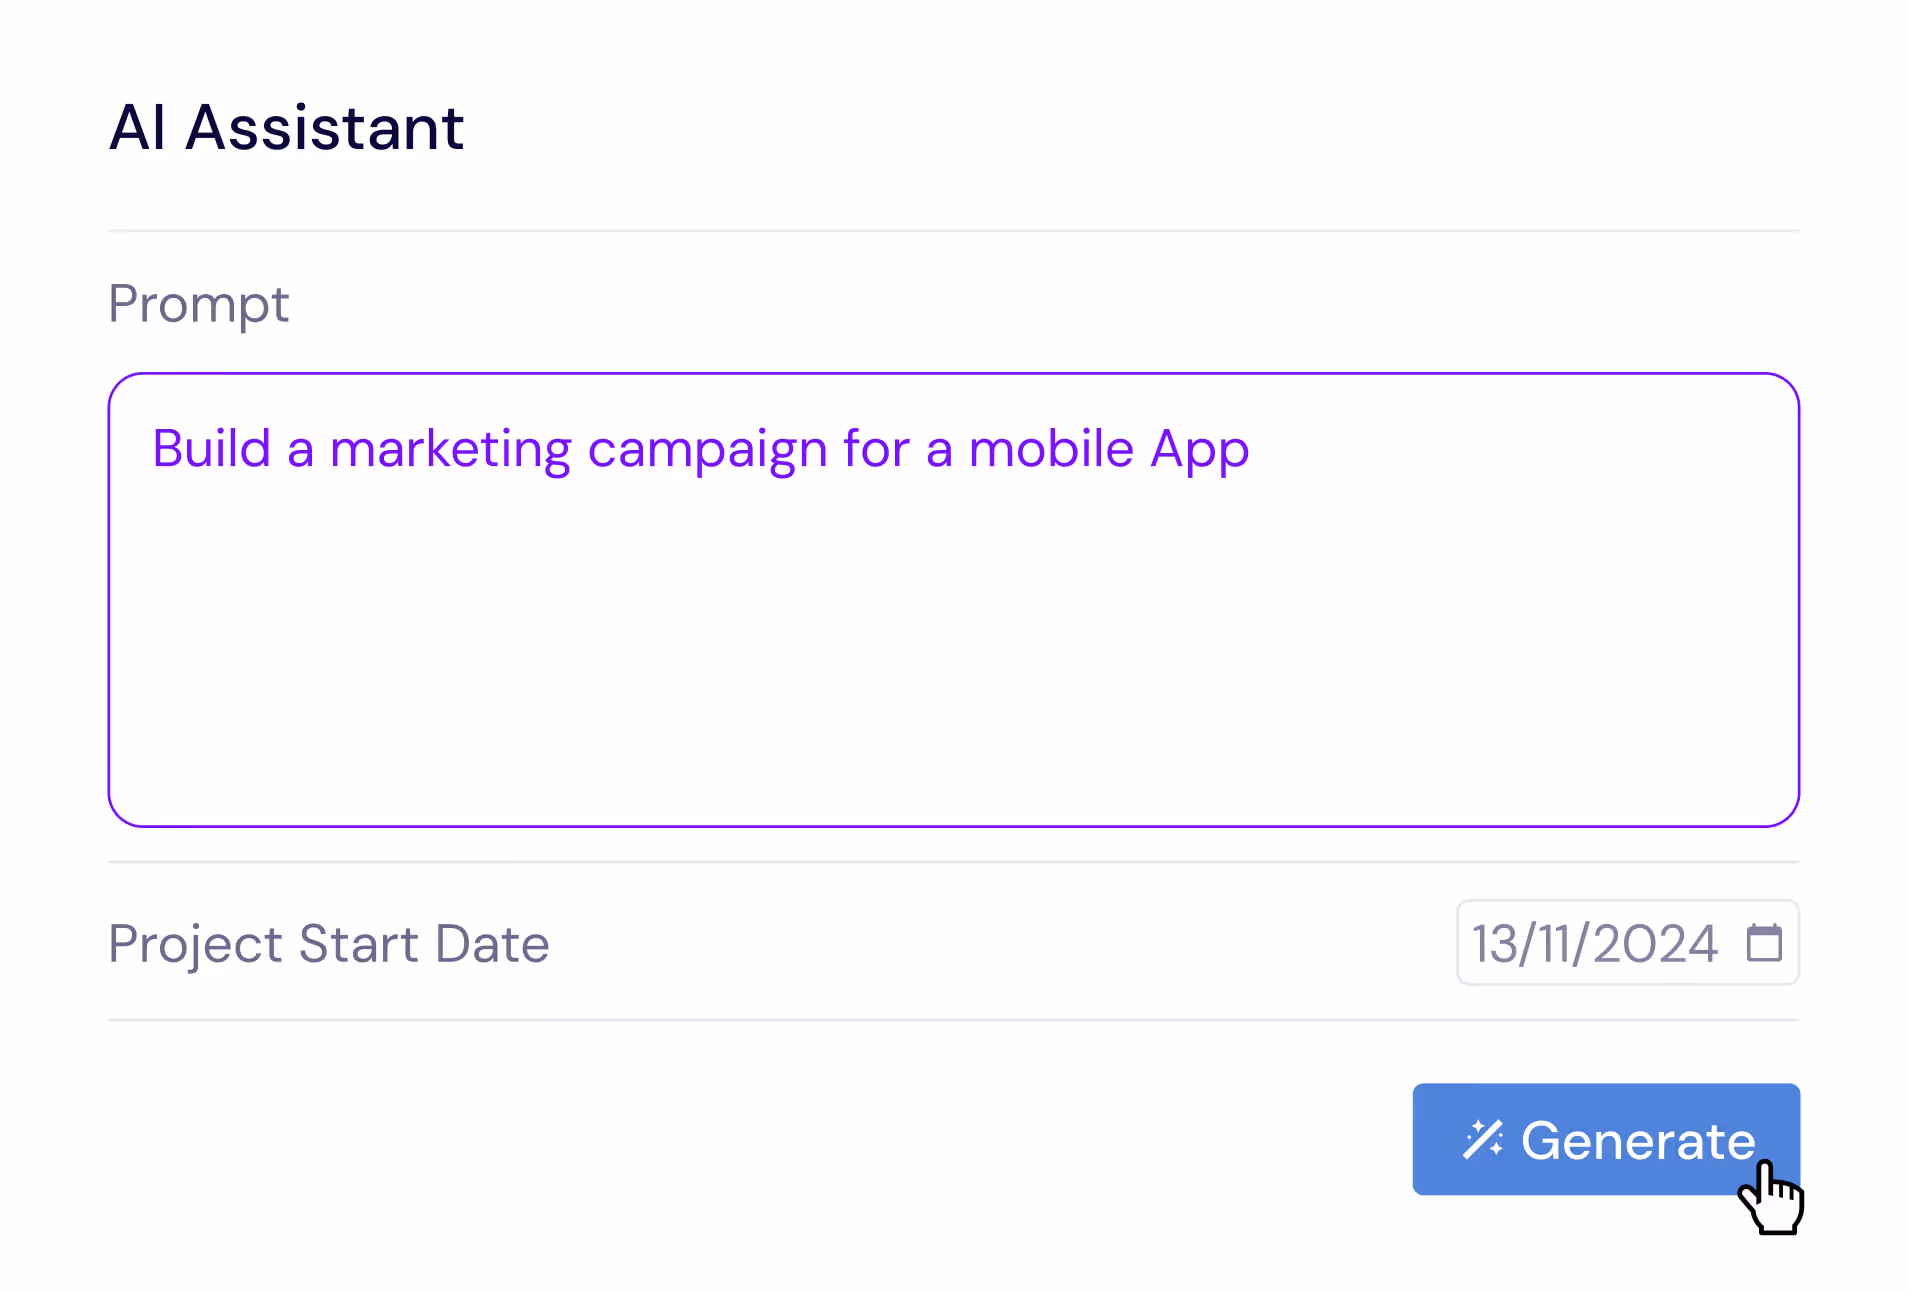
AI-Powered Production Planning
Describe your manufacturing project in plain English and let the AI Assistant generate a complete production plan with tasks, subtasks, estimated durations, and dependencies. Say something like 'Plan a production run for 5000 units with procurement, machining, assembly, quality inspection, packaging, and shipping phases' and receive a professional production schedule in seconds. Refine the generated plan with follow-up prompts, then save it as a template for similar production runs. The AI understands manufacturing concepts like lead times, batch processing, and sequential quality gates and multi-stage inspection workflows.
Multi-Shift and Multi-Line Scheduling
Manage production across multiple shifts, production lines, and facilities on a single Gantt chart. Assign operators and equipment to specific shifts, visualize capacity by line and shift, and identify opportunities to move work between lines to optimize throughput. For multi-plant operations, use workbooks to group facility-specific projects while maintaining cross-plant visibility. This multi-dimensional scheduling capability is essential for manufacturing organizations that need to maximize production capacity while maintaining quality standards across all shifts and facilities.
Delivery Coordination and Customer Commitments
Track outbound logistics and coordinate delivery schedules with customer commitments on your production timeline. Link finished goods milestones to shipping, customs clearance, and delivery tasks so you can see the end-to-end timeline from raw material arrival through customer delivery. When production delays occur, immediately assess the impact on delivery dates and communicate proactively with customers about revised timelines. This delivery visibility helps sales teams set accurate expectations and customer success teams manage relationships during schedule changes.
Multiple Views for Manufacturing Data
Switch between Gantt chart, Table View, Board View, and Overview depending on the information you need. Use the Gantt chart for production scheduling and dependency management, the Table View for detailed data analysis and inventory tracking, the Board View for visual work-in-progress management, and the Overview for plant-wide status reporting. Each view shows the same production data from a different perspective, making it easy to communicate with different audiences — shop floor managers, quality engineers, procurement teams, and executive leadership.