世界中の25,000以上のチームに信頼されています
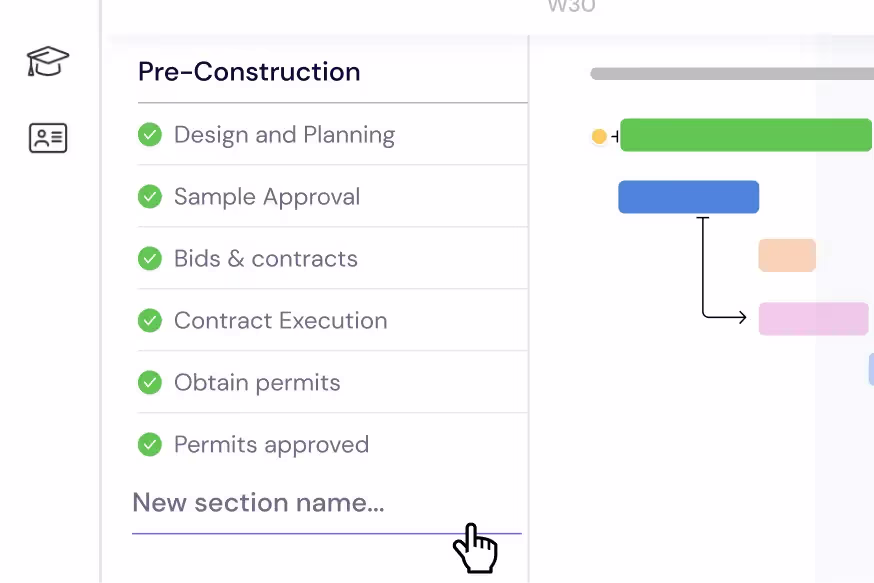
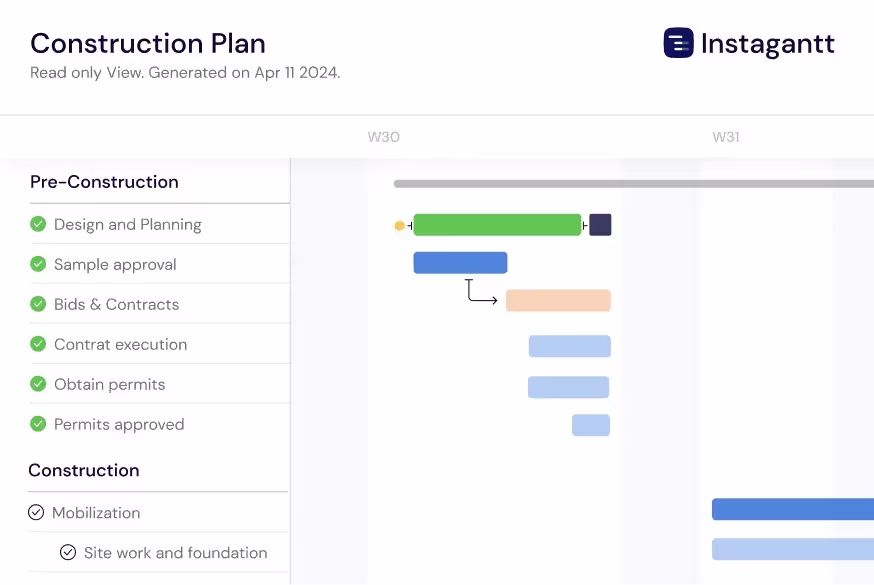
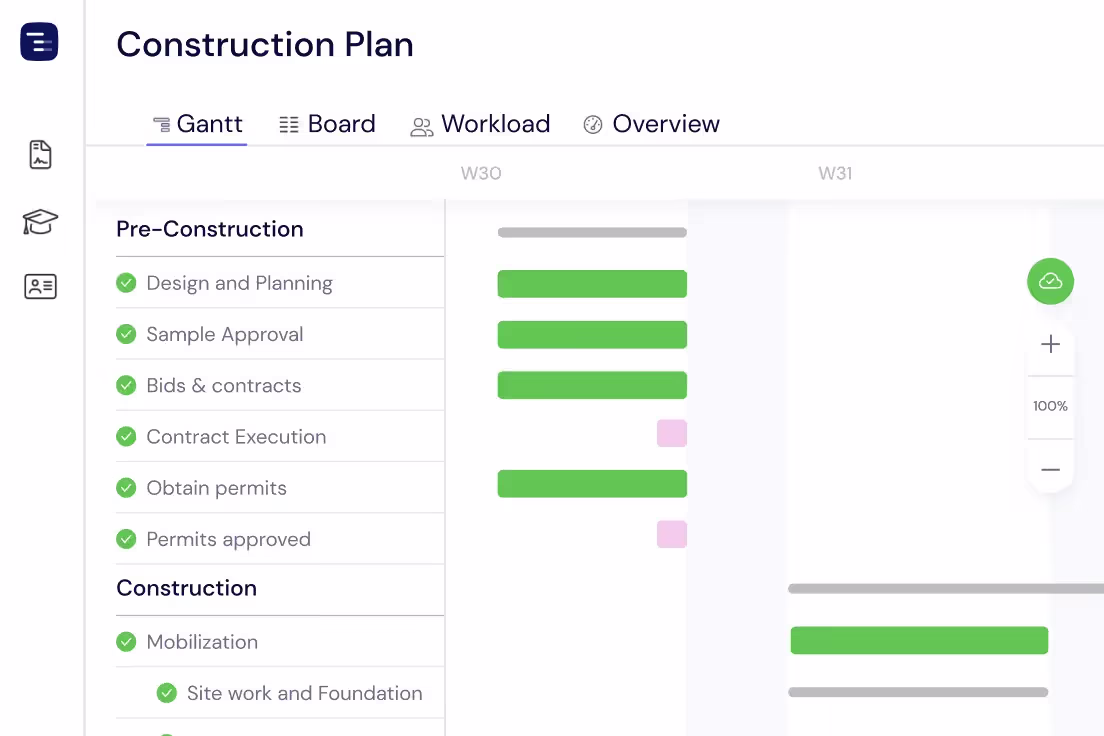
施工フェーズの計画
建設プロジェクトを管理可能なタスクとサブタスクに分割します。敷地造成や基礎工事から、構造、設備、仕上げまで、各フェーズを期限、依存関係、検査マイルストーンとともにガントチャート上で明確に整理します。
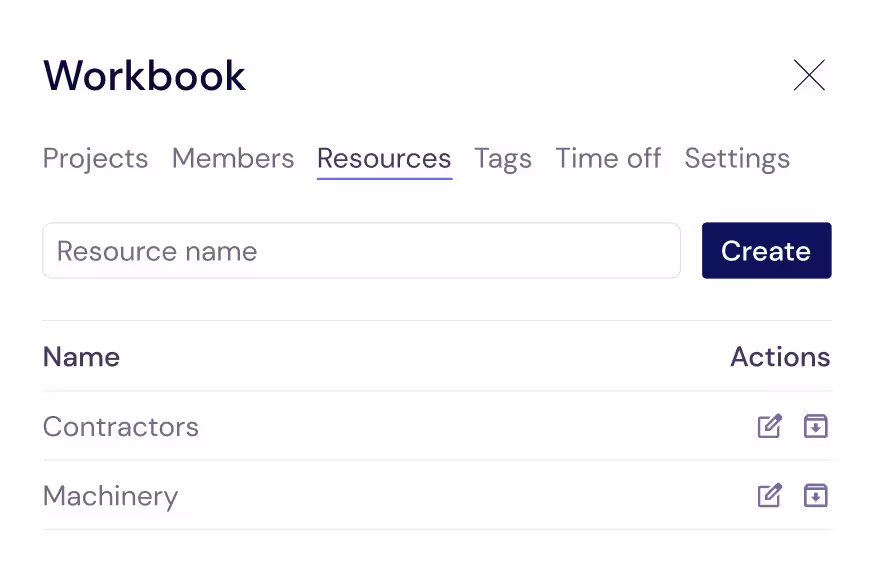
作業員と協力会社の管理
現場の稼働を支えるあらゆるリソース(一般作業員、熟練工、協力会社、レンタル機器など)を追跡します。これらをタスクに割り当てることで、誰が現場にいるのか、各工種がいつ開始予定なのかを常に把握できます。
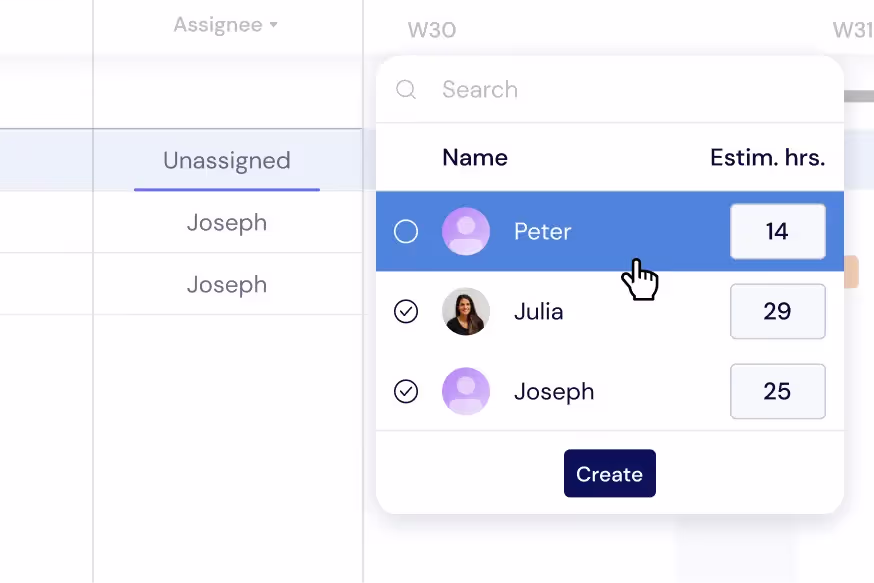
現場の負荷分散
作業員や工種間でタスクを分散させ、スケジュールの競合やコストのかかるダウンタイムを防ぎます。ガントチャート上で直接負荷を監視するか、ワークロードビューに切り替えて、稼働中の現場全体でリアルタイムに割り当てを再調整します。
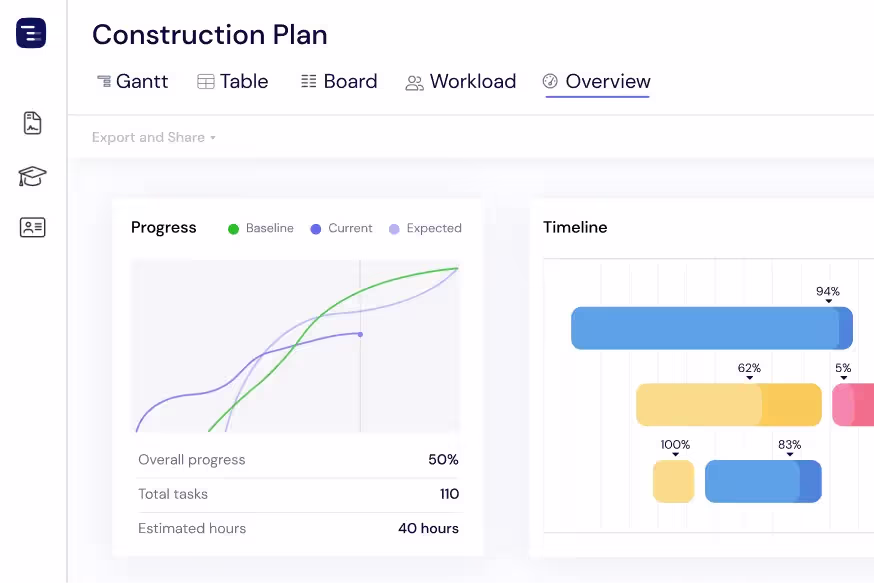
現場全体の概要を把握
オーバービュー(概要)ビューで、すべての稼働中のプロジェクトと現場を一目で確認できます。詳細に埋もれることなく、施工進捗、許可期限、作業員の空き状況を監視します。必要に応じて、ガント、テーブル、ボードの各ビューを切り替えられます。
クライアントやオーナーへの進捗共有
施工タイムラインをPDF、PNG、またはスプレッドシートとしてエクスポートし、物件所有者、ゼネコン、投資家と共有できます。パブリックスナップショット機能を使用すれば、関係者にInstagantt上の施工スケジュールの最新の状態(閲覧のみ)を公開できます。
Track Inspections and Permits
Schedule building inspections, permit applications, and regulatory checkpoints throughout your construction timeline with clear dependencies to prerequisite work. Connect inspection milestones to the construction tasks that must be completed before each inspection can pass — framing inspection requires framing completion, electrical rough-in inspection requires wiring installation. Track inspection request lead times and schedule them proactively so inspectors do not become a bottleneck in your build sequence. When an inspection fails, immediately see the impact on downstream phases and adjust your schedule accordingly.
Manage Material Deliveries
Track every material order from purchase requisition through supplier confirmation, shipping, and on-site delivery on your project timeline. Link material delivery dates to construction tasks with dependencies so you can see immediately when a late shipment will delay work. Long-lead items like structural steel, custom windows, specialty mechanical equipment, and imported fixtures can be tracked months in advance to ensure they arrive before the trade crew that needs them. When a supplier delays a shipment, the Gantt chart automatically shows the cascade effect on your construction schedule.
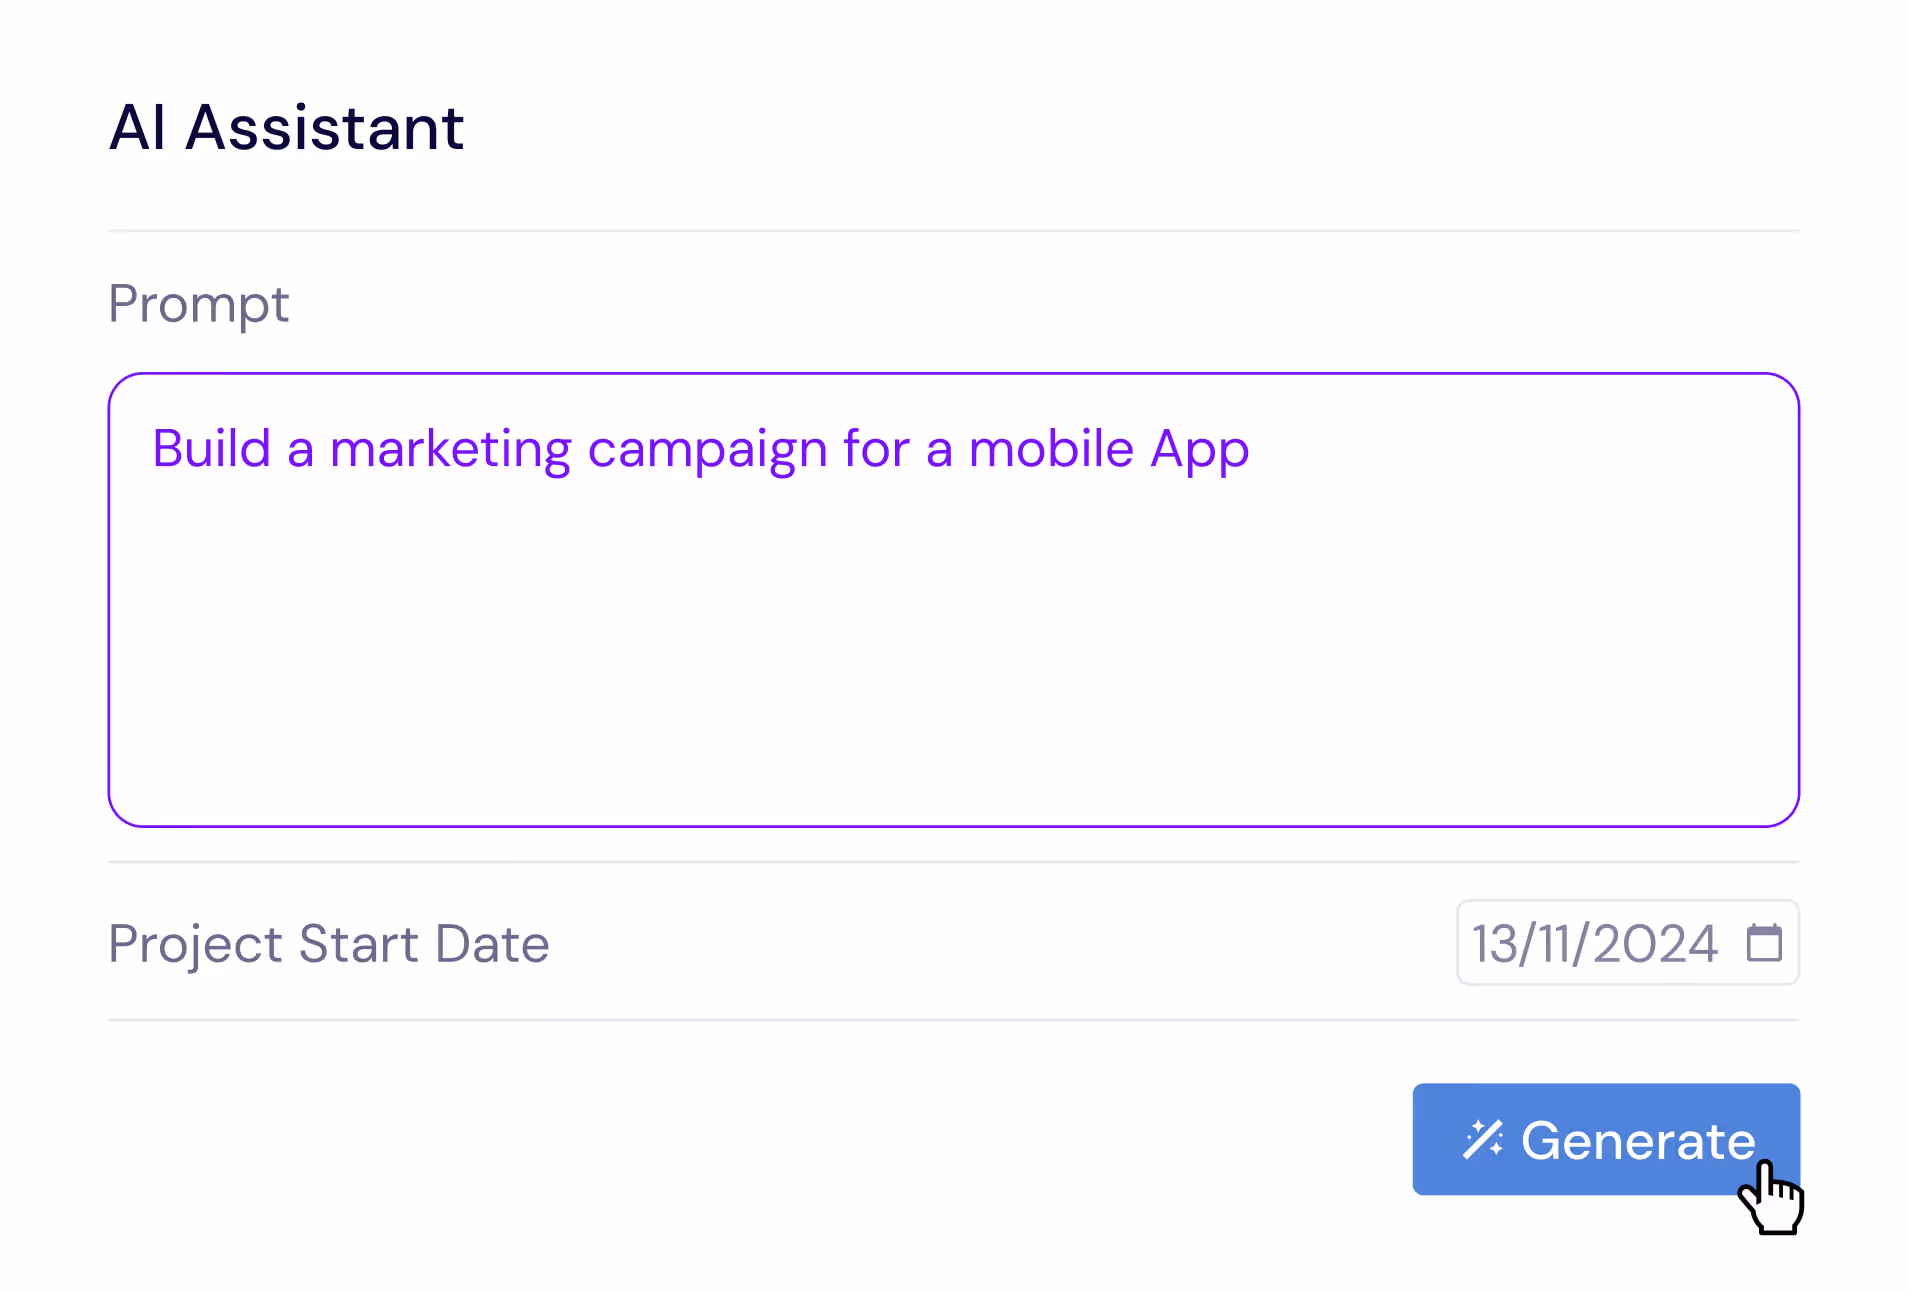
AI-Powered Build Planning
Describe your construction project in plain English and let the AI Assistant generate a complete build plan with phases, tasks, subtasks, estimated durations, and trade dependencies. Say something like 'Plan a 3-bedroom residential construction with site prep, foundation, framing, MEP, drywall, finishing, and landscaping phases' and receive a professional construction schedule in seconds. Refine the generated plan with follow-up prompts, then save it as a template for similar builds. The AI understands construction concepts like trade sequencing, inspection gates, and weather buffers.
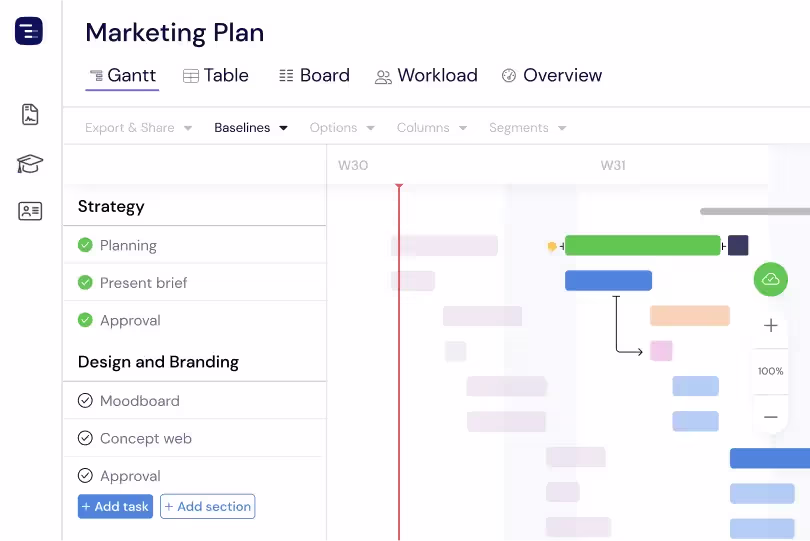
Compare Schedules with Baselines
Create baseline snapshots of your construction schedule at contract signing, groundbreaking, or any major milestone and compare the original plan against actual progress throughout the build. Baselines make schedule drift visible and quantifiable — see which phases started late, which trades took longer than estimated, and how weather delays and change orders have shifted the overall timeline. This plan-versus-actual comparison is essential for construction managers who need to document schedule changes for contract compliance, justify timeline extensions, improve estimating accuracy for future projects, and maintain accurate project documentation. The visual baseline overlay makes schedule changes immediately apparent to all stakeholders.
Multiple Views for Construction Teams
Switch between Gantt chart, Table View, Board View, and Overview depending on the information your construction team needs. Use the Gantt chart for detailed phase planning with trade dependencies, the Table View for material tracking and cost analysis, the Board View for punch list and inspection management, and the Overview for site-wide progress reporting. Each view shows the same project data from a different perspective. Site managers can run daily coordination meetings using the Gantt chart and generate owner reports from the Overview without maintaining separate documents or spreadsheets.
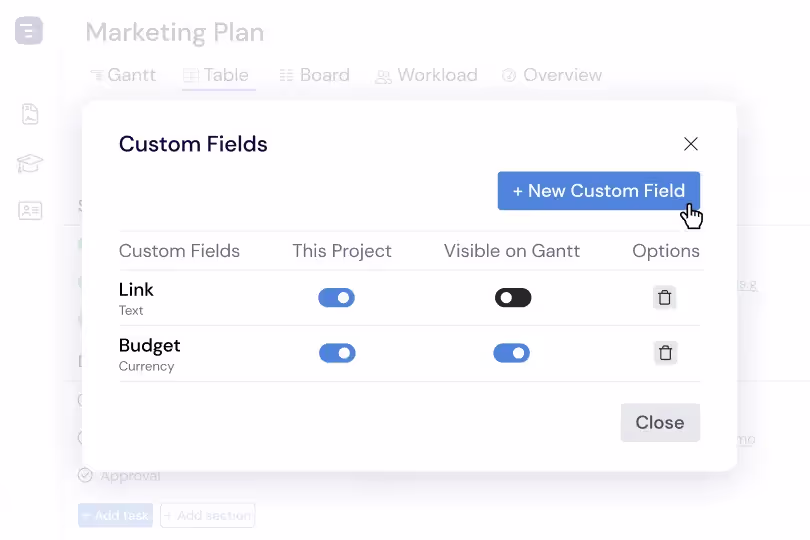
Custom Fields for Construction Data
Add custom fields to capture construction-specific data like cost per task, trade classification, permit status, inspection result, change order number, and contract reference. Custom fields appear in the Table View as sortable, filterable columns, making it easy to generate reports by trade, analyze cost distribution by phase, or track permit approval status across all construction activities. This construction-specific data layer transforms your Gantt chart from a simple timeline into a comprehensive project management system tailored to how construction projects are actually managed and reported.