世界中の25,000以上のチームに信頼されています
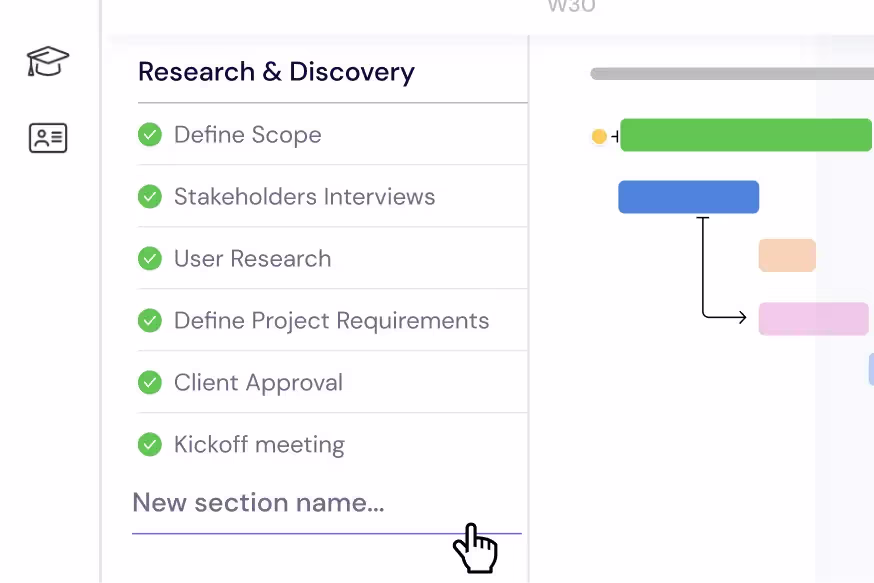
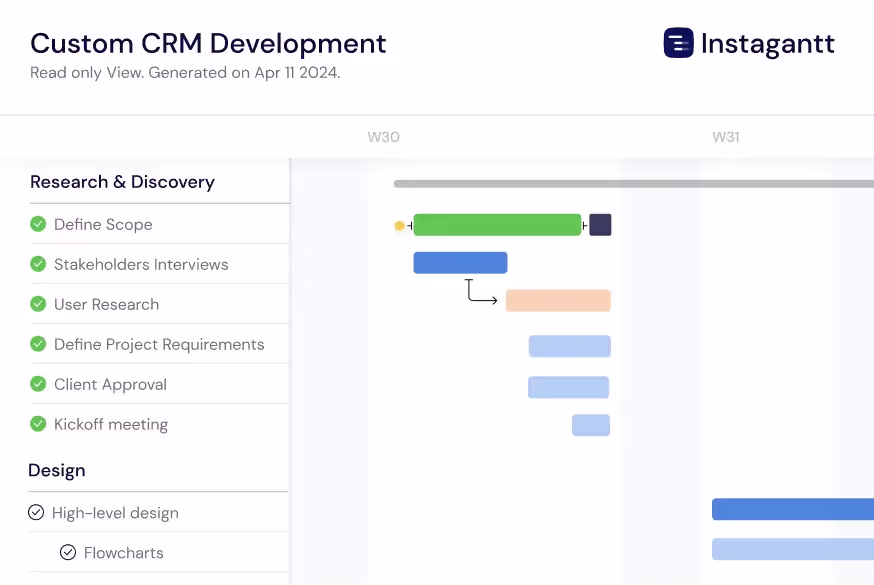
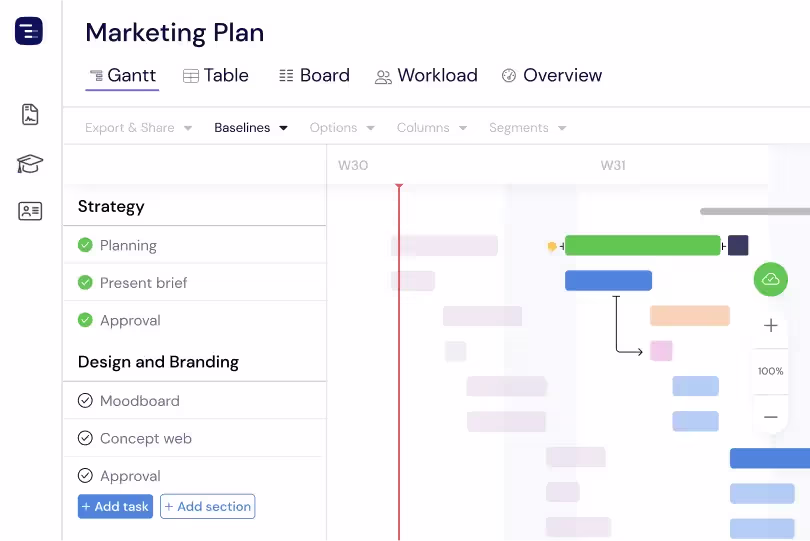
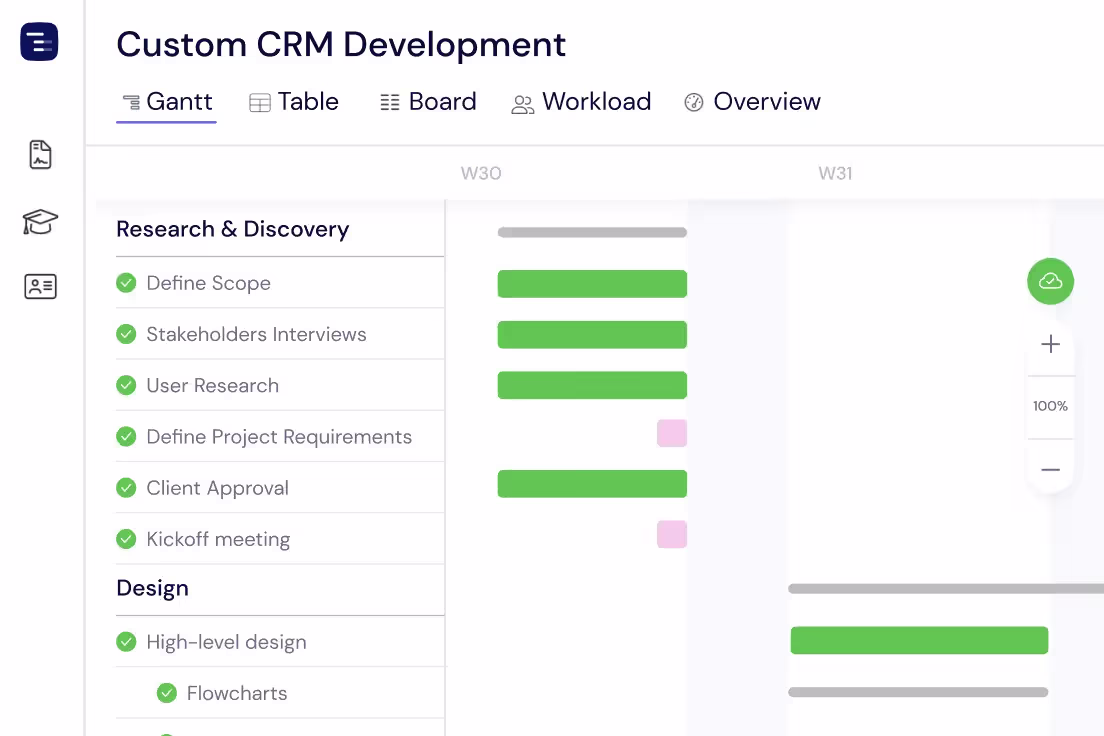
スプリントとリリースの計画
ロードマップをエピック、ユーザーストーリー、サブタスクに分解します。機能計画からコードフリーズまで、各リリースサイクルを期限、依存関係、マイルストーンとともにガントチャート上の明確なセクションに整理します。
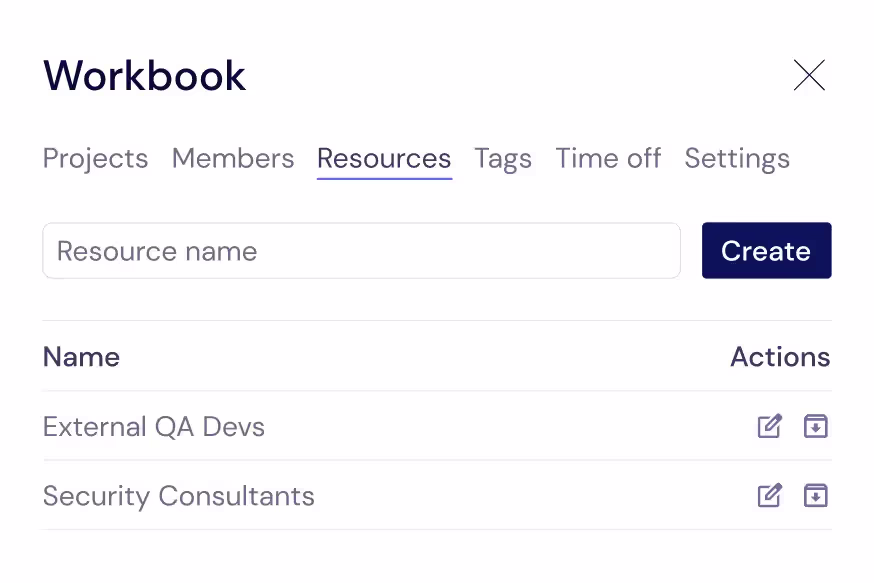
エンジニアリングチームの管理
コードベースを動かし続けるすべての貢献者(開発者、QAエンジニア、デザイナー、外部請負業者)を追跡します。タスクを割り当てることで、誰が何に取り組んでいるか、いつ対応可能かを常に把握できます。
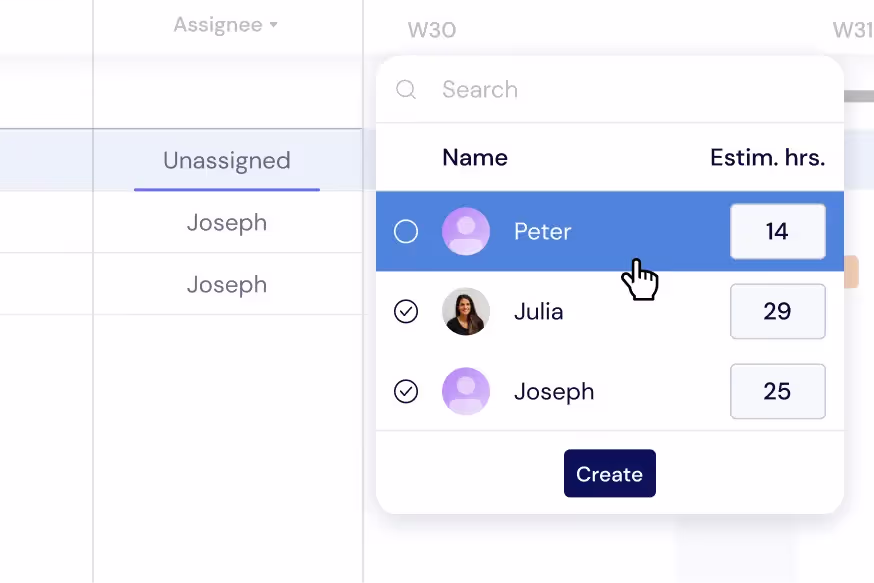
開発者のワークロードのバランス調整
燃え尽き症候群や納期遅れを防ぐため、エンジニアリングチーム全体にタスクを分散させます。ガントチャート上で直接個々のワークロードを監視するか、ワークロードビューに切り替えてスプリントの割り当てをリアルタイムで再調整します。
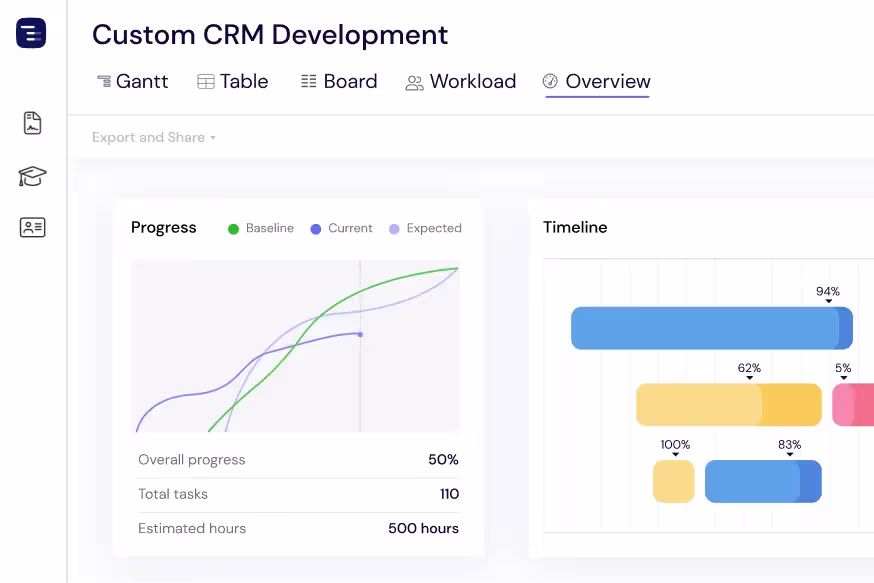
プロジェクト横断的な概要の把握
オーバービュービューを使用すると、進行中のすべてのプロジェクトとリリースを一目で確認できます。詳細に迷い込むことなく、スプリントの進捗、今後の期限、チームのキャパシティを監視できます。必要に応じて、ガント、テーブル、ボードビューを切り替えられます。
ステークホルダーへのアップデート共有
リリースのタイムラインをPDF、PNG、またはスプレッドシートとしてエクスポートし、プロダクトオーナー、エグゼクティブ、クライアントと共有できます。パブリックスナップショットを使用すれば、Instagantt上の開発スケジュールをステークホルダーに読み取り専用のライブビューとして提供できます。
Track Technical Debt and Bug Fixes
Manage technical debt reduction and critical bug fixes alongside feature development on the same timeline. Create dedicated sections for tech debt sprints, security patches, and performance improvements so engineering managers can visualize the balance between new features and maintenance work. Link bug resolution to release milestones with dependencies to ensure release-blocking bugs are resolved before deployment. This unified view helps engineering leaders communicate to stakeholders why technical investment is necessary and how it fits within the overall release schedule.
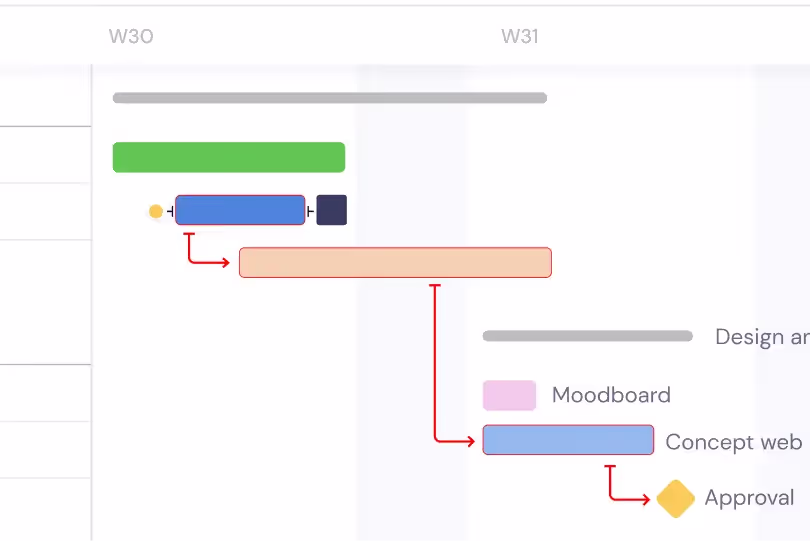
Visualize the Critical Path
Enable critical path highlighting to see which chain of dependent tasks determines your release date. The critical path reveals the minimum time needed to deliver your release and identifies exactly which tasks cannot slip without delaying the entire release. Focus engineering effort on critical path tasks during crunch time, and use the critical path analysis to make informed decisions about scope cuts, timeline extensions, or additional resourcing. Understanding the critical path transforms release planning from guesswork into data-driven decision making.
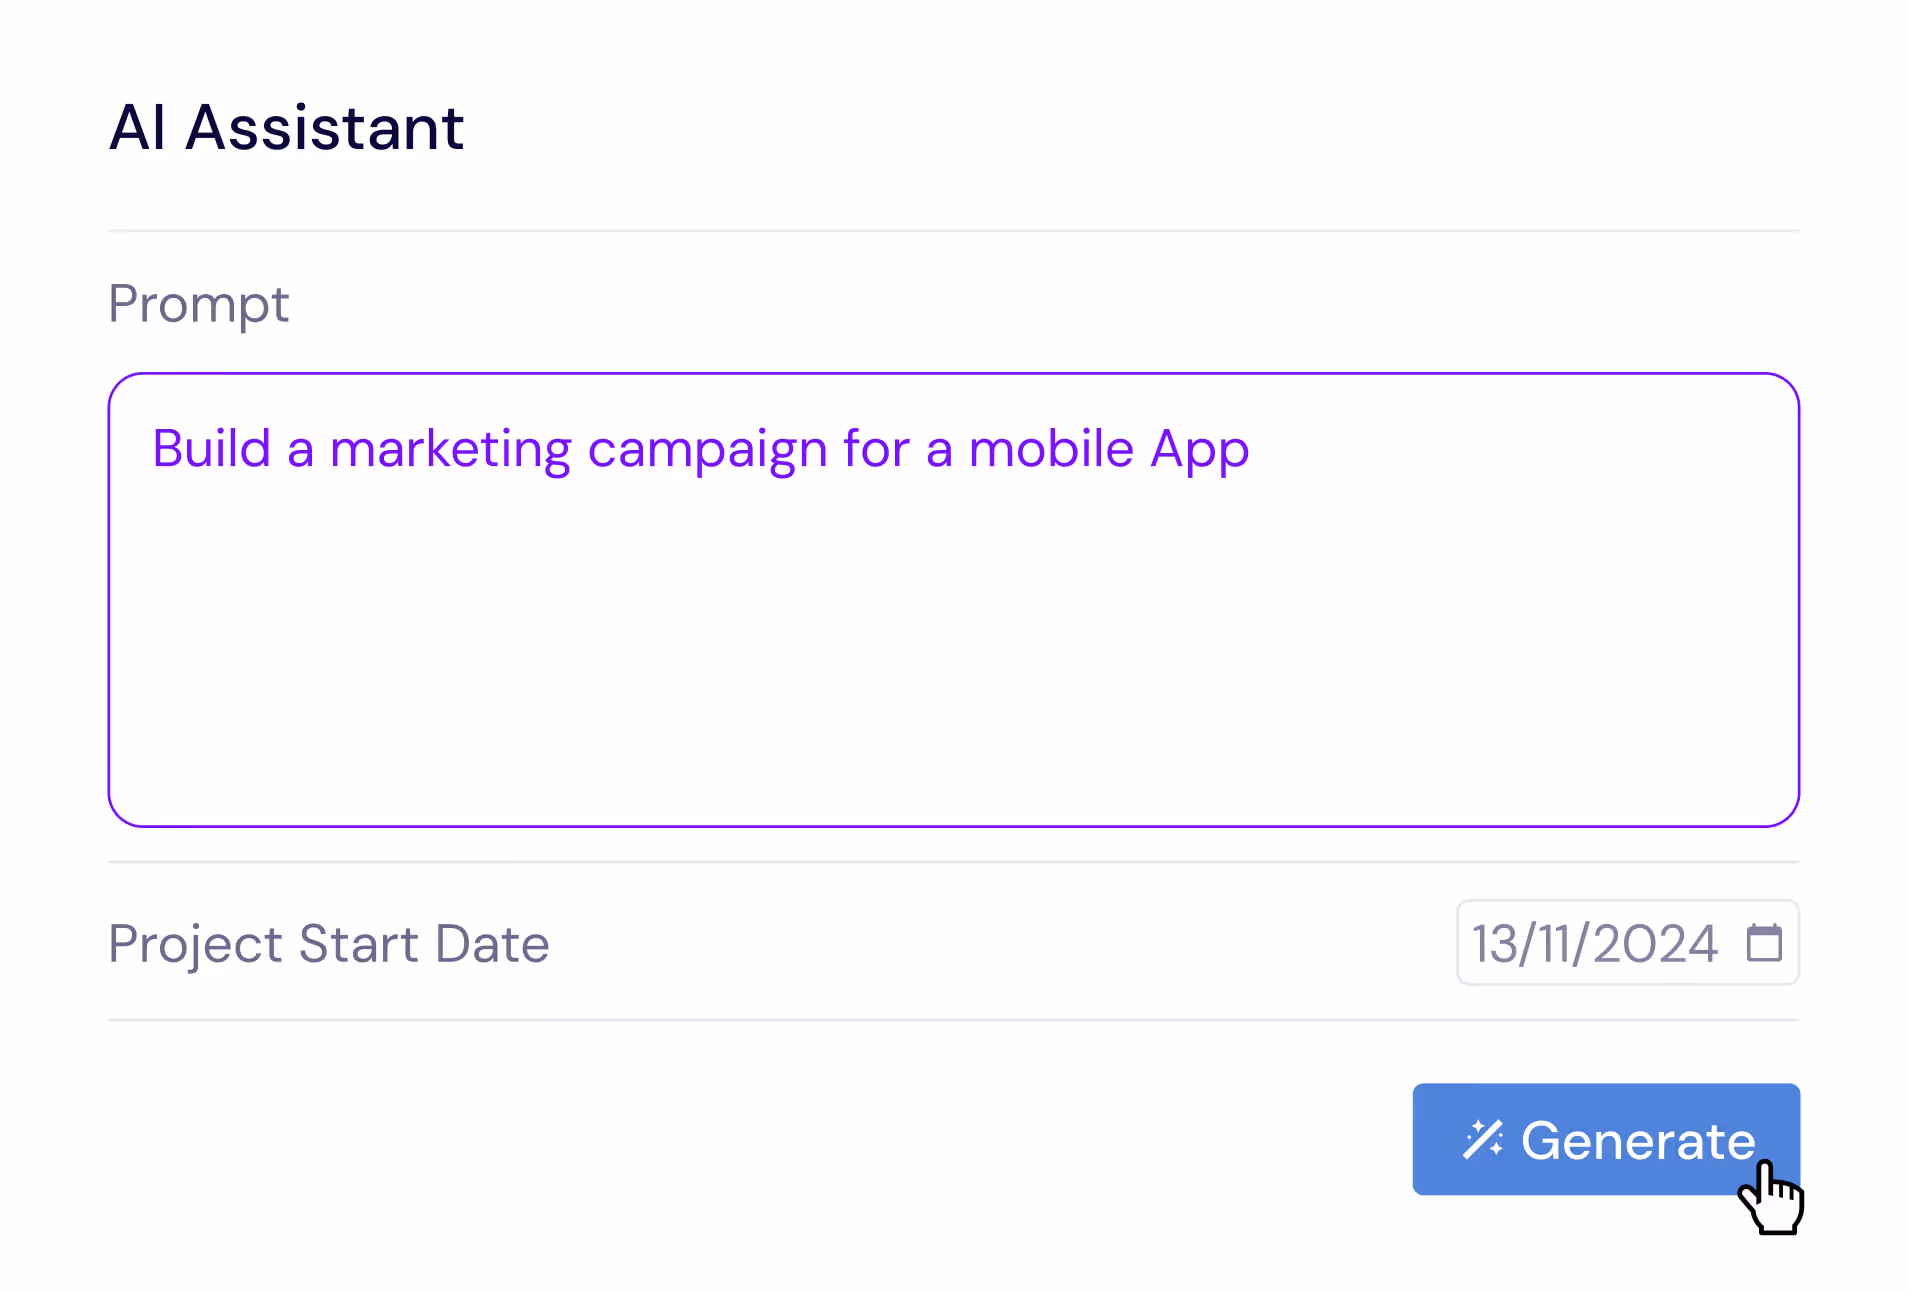
AI-Powered Sprint Planning
Describe your release in plain English and let the AI Assistant generate a complete project plan with epics, user stories, subtasks, estimated durations, and dependencies. Say something like 'Plan a SaaS feature release with API design, frontend development, backend development, integration testing, and staged rollout phases' and receive a professional release structure in seconds. Refine the generated plan with follow-up prompts, then save it as a template for future releases. The AI understands software development concepts like code reviews, staging environments, and feature flag rollouts.
Compare Releases with Baselines
Create baseline snapshots of your release plan at sprint boundaries, planning milestones, or stakeholder checkpoints and compare the original plan against actual progress. Baselines are invaluable for retrospectives and estimation improvement. They help engineering managers quantify schedule drift — see which features took longer than estimated, which were added mid-cycle, and how the overall timeline shifted since the release was planned. This data improves future estimation accuracy and gives engineering leaders the evidence they need to push back on unrealistic scope additions or timeline compression.
Multiple Views for Engineering Teams
Switch between Gantt chart, Table View, Board View, and Overview depending on the context. Use the Gantt chart for release planning and cross-team dependency management, the Table View for detailed sprint data analysis, the Kanban Board for daily stand-up tracking and sprint execution, and the Overview for engineering leadership reporting. Each view shows the same project data from a different perspective. Engineering managers can present to executives using the Overview, plan sprints using the Gantt chart, and track daily progress using the Board — all from the same project without maintaining separate tools.
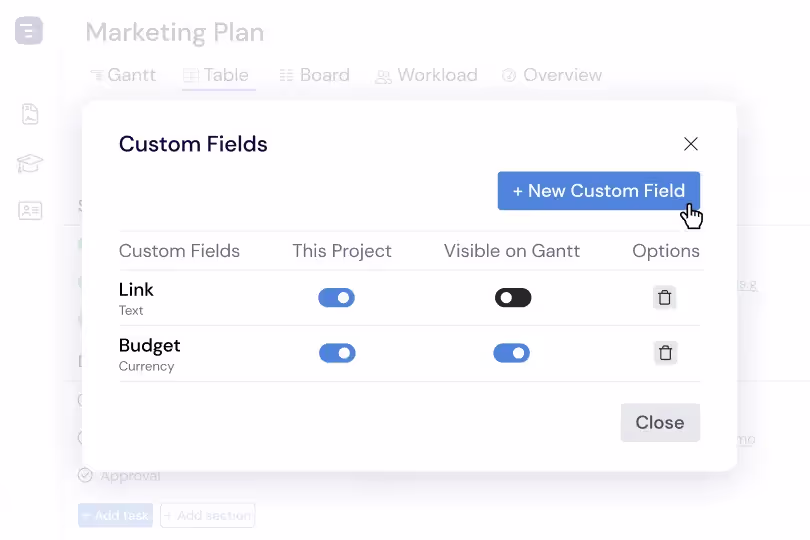
Custom Fields for Engineering Data
Add custom fields to capture engineering-specific data like story points, sprint velocity, code review status, deployment environment, feature flag state, and technical debt classification. Custom fields appear as sortable, filterable columns in the Table View, making it easy to analyze your engineering portfolio from multiple dimensions. Sort by story points to understand sprint capacity, filter by deployment status to track release readiness, or group by team to see workload distribution across engineering squads.