Gantt Software for Software Development
Software teams use Instagantt to plan releases, coordinate sprints, and track cross-team dependencies on visual Gantt charts. Bridge the gap between daily sprint execution and long-term release planning with timelines that show how individual tasks connect to shipping dates and milestones.
Trusted by 25,000+ Teams across the Globe
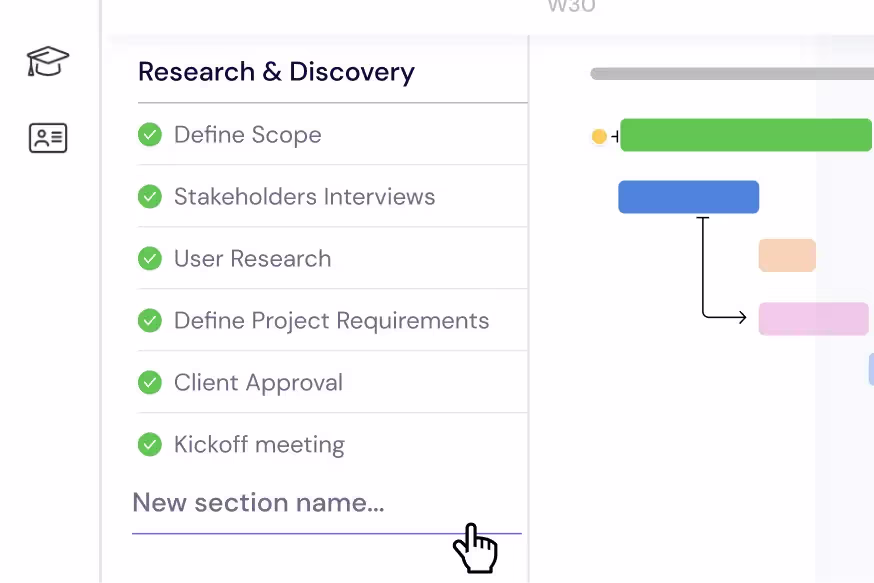
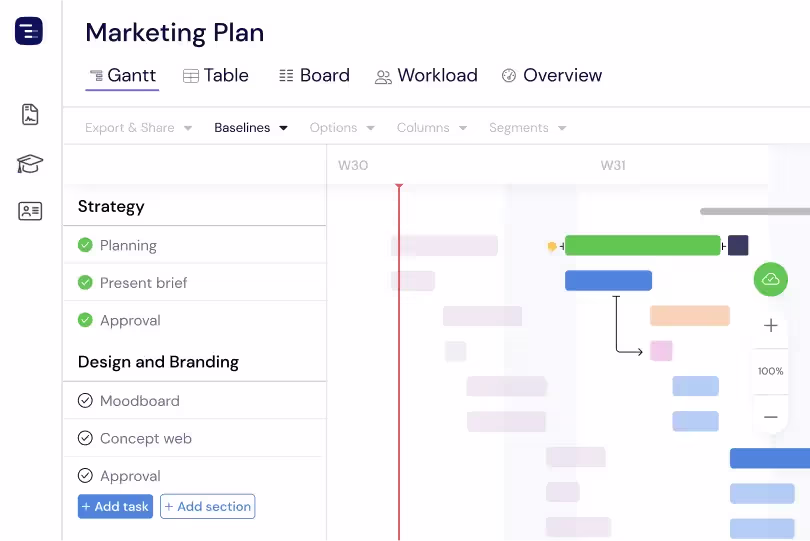
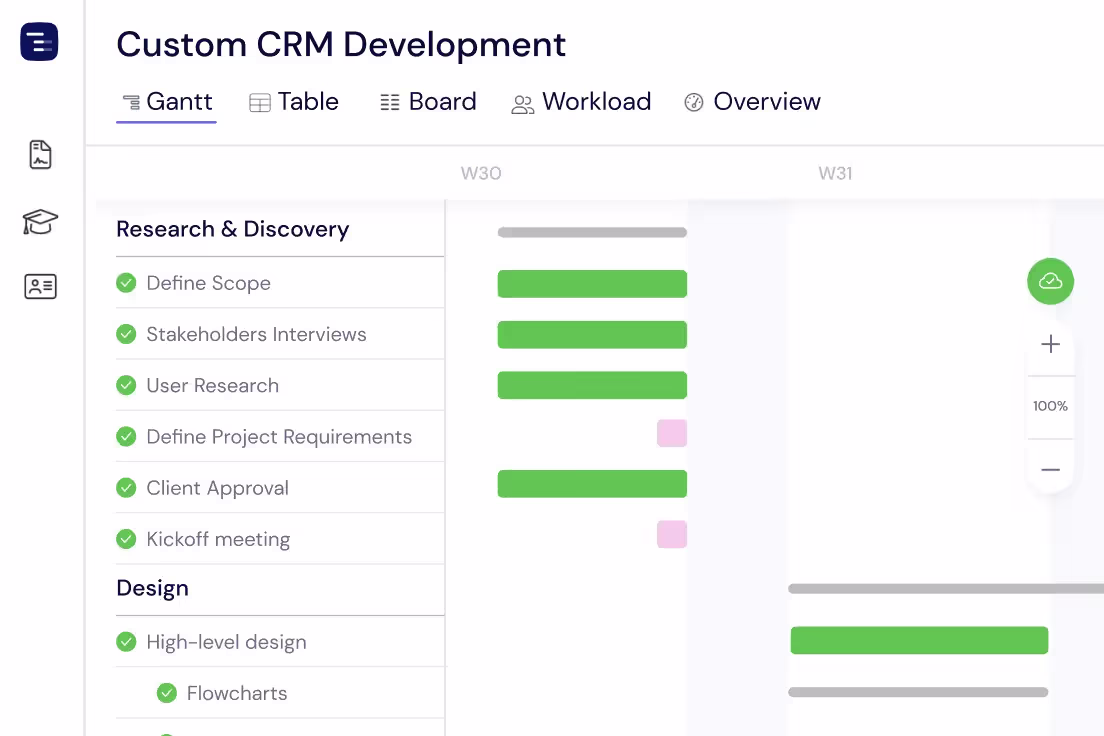
Plan Sprints & Releases
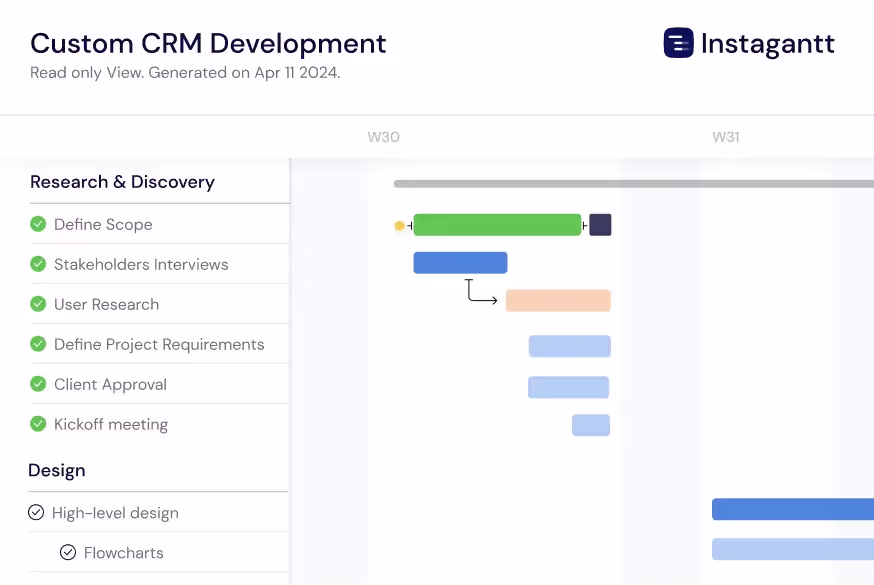
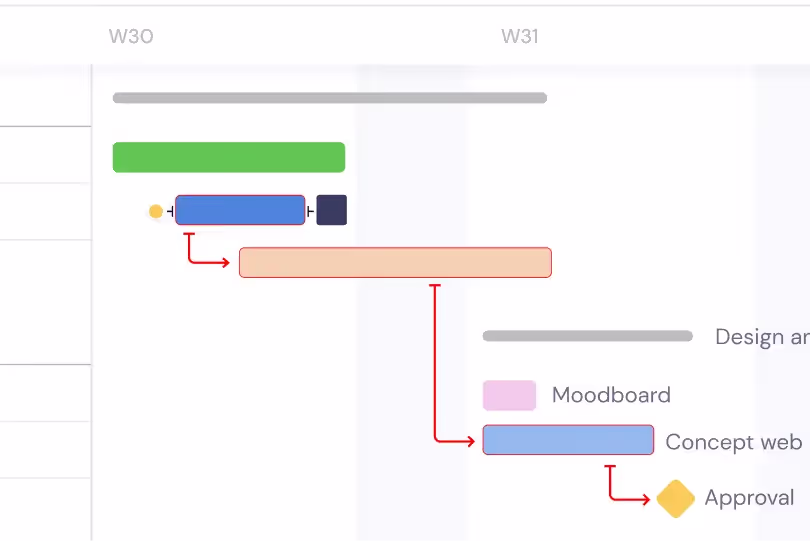
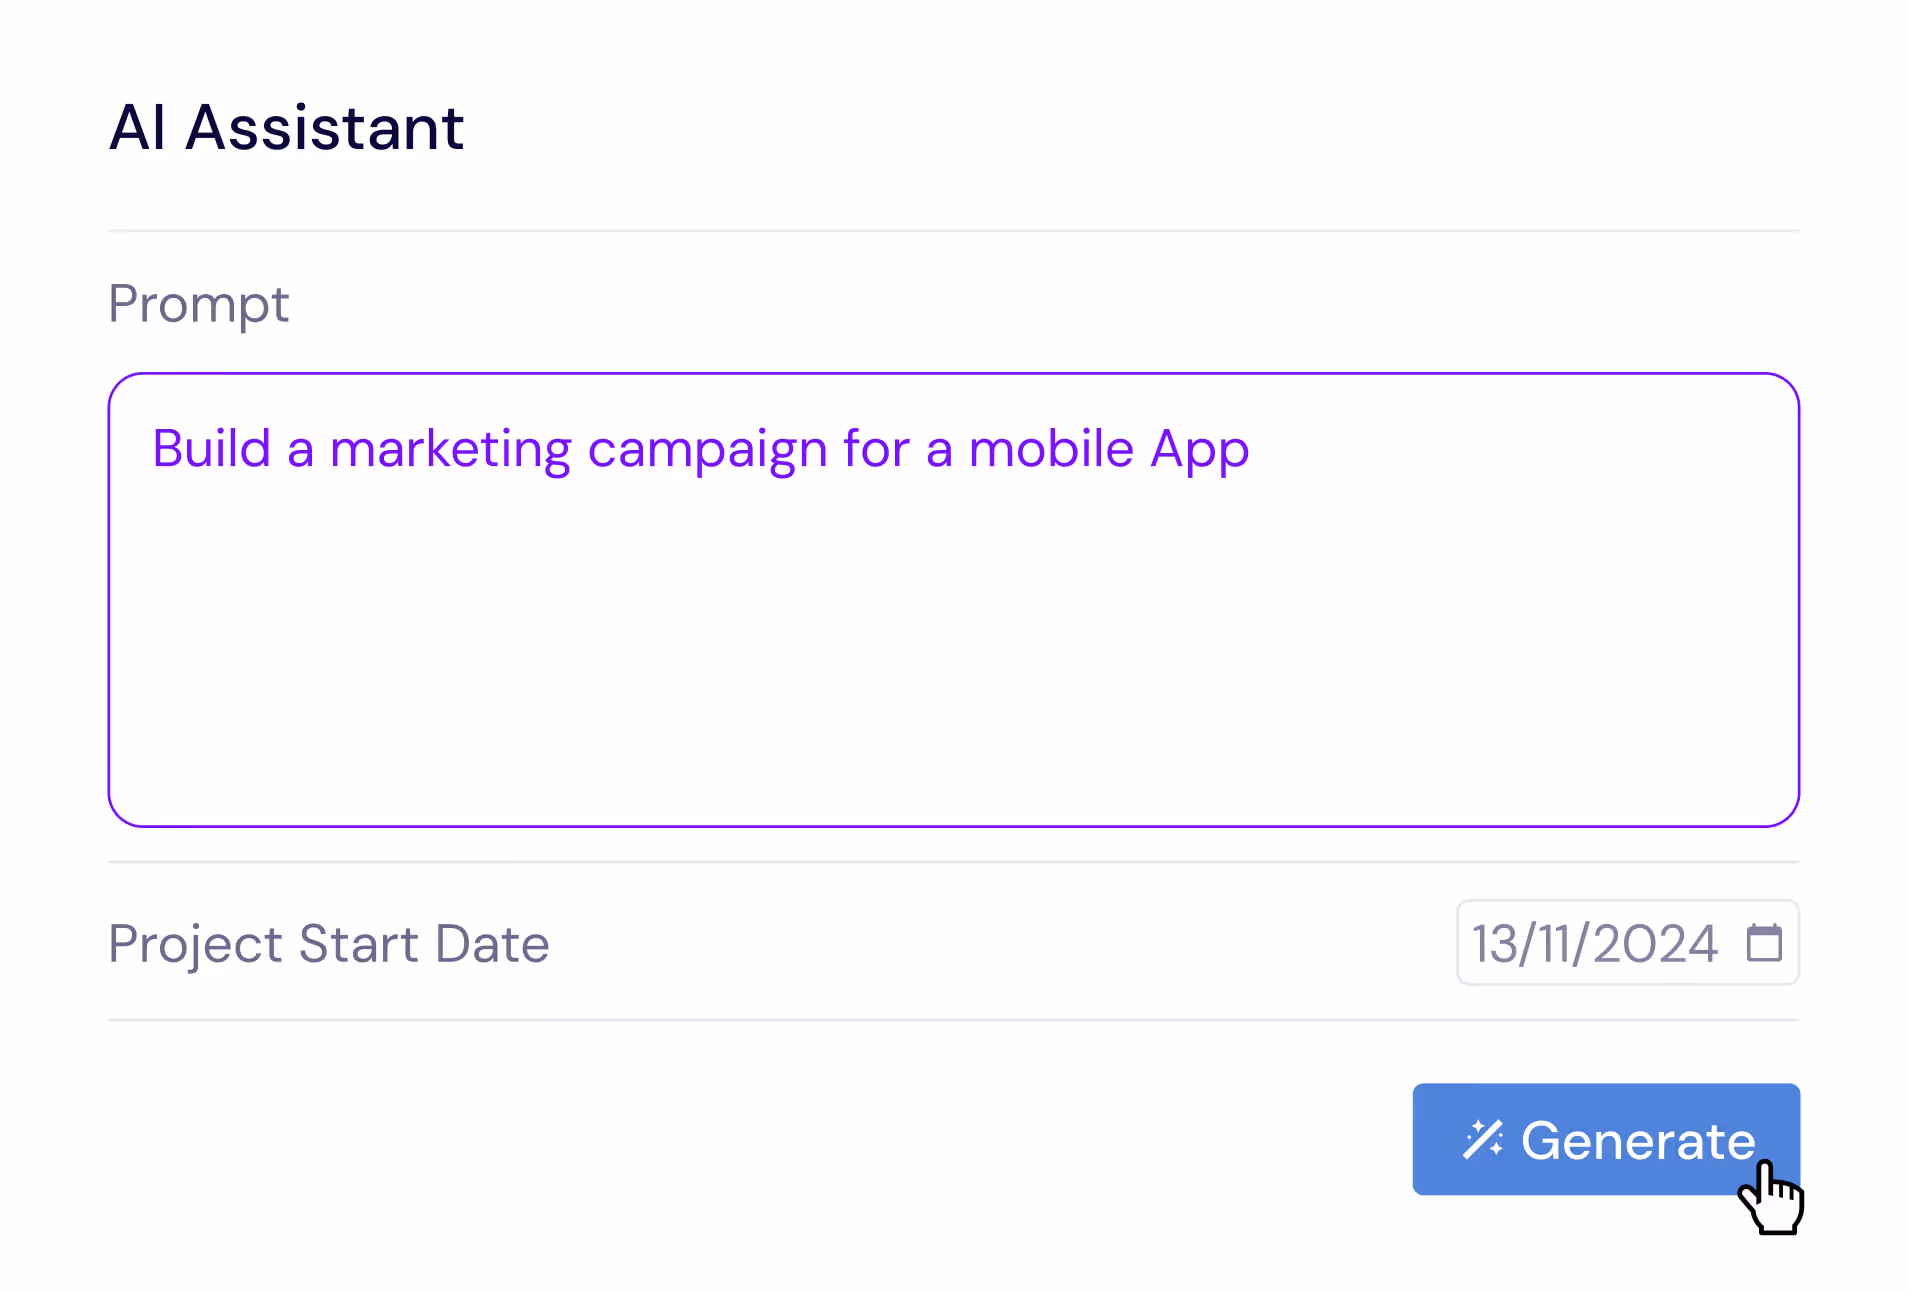
Break down your product roadmap into epics, user stories, and subtasks that mirror your engineering workflow. Organize each release cycle — from feature planning and design through implementation, code review, QA testing, staging deployment, and production launch — into clear sections with deadlines, dependencies, and milestones on your Gantt chart. Instagantt's AI Assistant can generate initial release plan structures from a project description, saving engineering managers hours of manual planning. As sprints progress, drag and drop tasks to adjust timelines and watch dependent work automatically reschedule to maintain a feasible release plan.
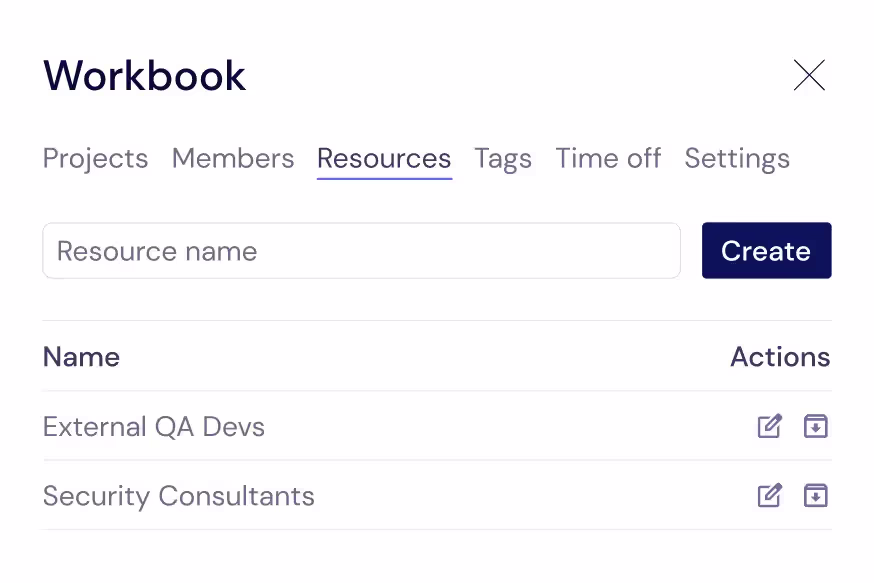
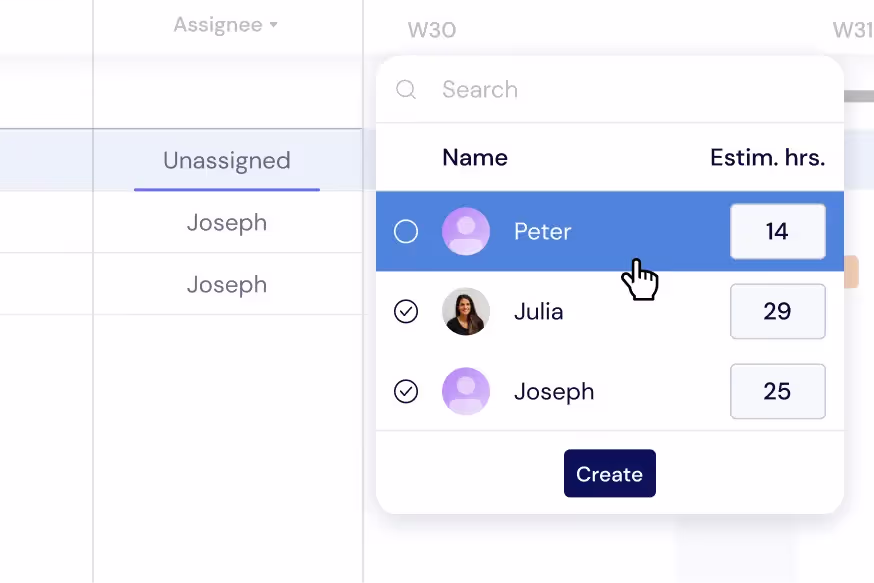
Manage Your Engineering Team
Track every contributor that keeps your codebase moving — senior developers, junior engineers, QA analysts, UX designers, DevOps engineers, and external contractors. Assign each person to specific tasks with estimated hours so you can see individual capacity at a glance. When you need to hire a contractor for a specialized feature or redistribute work because a team member is on vacation, Instagantt's workload visualization shows exactly who has bandwidth and who is overcommitted. This resource visibility prevents the common engineering problem of key developers being silently overloaded while others have capacity.
Balance Developer Workloads
Distribute tasks across your engineering team to prevent burnout, reduce context-switching, and maintain consistent code quality. Monitor individual developer workloads directly on your Gantt chart — color-coded indicators show when engineers are at capacity, underutilized, or overallocated. Switch to the dedicated Workload View for a comprehensive dashboard that makes it easy to rebalance sprint assignments in real time. Balanced workloads lead to better code reviews, fewer bugs making it to production, and more predictable sprint velocity.
Get a Cross-Project Overview
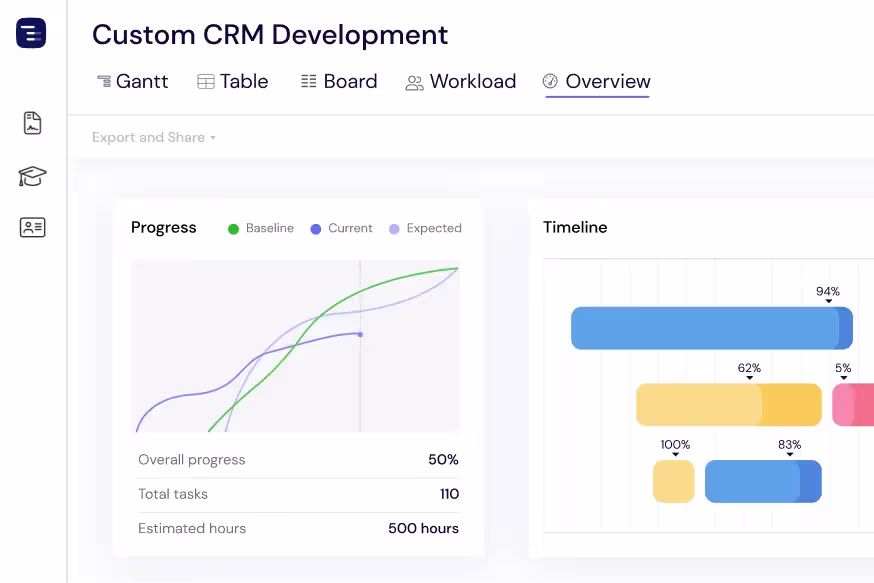
See every active project, release, and sprint at a glance with the Overview View. Monitor sprint progress, upcoming milestones, deployment dates, and team capacity without getting lost in individual task details. Switch between Gantt, Table, and Board views depending on the information you need. The Overview View is invaluable during weekly engineering syncs, sprint planning sessions, and executive status reviews where engineering managers need to communicate the state of multiple projects quickly and identify resource conflicts across teams.
Share Updates with Stakeholders
Export release timelines as PDF for executive presentations, PNG for slide decks, or spreadsheets for detailed analysis. Instagantt's Public Snapshot feature generates shareable URLs that give product owners, executives, and clients a live, read-only view of your development schedule. Stakeholders can check release status, review milestone dates, and see team assignments without needing an Instagantt account or attending a status meeting. This transparency builds trust between engineering and the rest of the organization and reduces the overhead of manual status reporting.
Track Technical Debt and Bug Fixes
Manage technical debt reduction and critical bug fixes alongside feature development on the same timeline. Create dedicated sections for tech debt sprints, security patches, and performance improvements so engineering managers can visualize the balance between new features and maintenance work. Link bug resolution to release milestones with dependencies to ensure release-blocking bugs are resolved before deployment. This unified view helps engineering leaders communicate to stakeholders why technical investment is necessary and how it fits within the overall release schedule.
Visualize the Critical Path
Enable critical path highlighting to see which chain of dependent tasks determines your release date. The critical path reveals the minimum time needed to deliver your release and identifies exactly which tasks cannot slip without delaying the entire release. Focus engineering effort on critical path tasks during crunch time, and use the critical path analysis to make informed decisions about scope cuts, timeline extensions, or additional resourcing. Understanding the critical path transforms release planning from guesswork into data-driven decision making.
AI-Powered Sprint Planning
Describe your release in plain English and let the AI Assistant generate a complete project plan with epics, user stories, subtasks, estimated durations, and dependencies. Say something like 'Plan a SaaS feature release with API design, frontend development, backend development, integration testing, and staged rollout phases' and receive a professional release structure in seconds. Refine the generated plan with follow-up prompts, then save it as a template for future releases. The AI understands software development concepts like code reviews, staging environments, and feature flag rollouts.
Compare Releases with Baselines
Create baseline snapshots of your release plan at sprint boundaries, planning milestones, or stakeholder checkpoints and compare the original plan against actual progress. Baselines are invaluable for retrospectives and estimation improvement. They help engineering managers quantify schedule drift — see which features took longer than estimated, which were added mid-cycle, and how the overall timeline shifted since the release was planned. This data improves future estimation accuracy and gives engineering leaders the evidence they need to push back on unrealistic scope additions or timeline compression.
Multiple Views for Engineering Teams
Switch between Gantt chart, Table View, Board View, and Overview depending on the context. Use the Gantt chart for release planning and cross-team dependency management, the Table View for detailed sprint data analysis, the Kanban Board for daily stand-up tracking and sprint execution, and the Overview for engineering leadership reporting. Each view shows the same project data from a different perspective. Engineering managers can present to executives using the Overview, plan sprints using the Gantt chart, and track daily progress using the Board — all from the same project without maintaining separate tools.
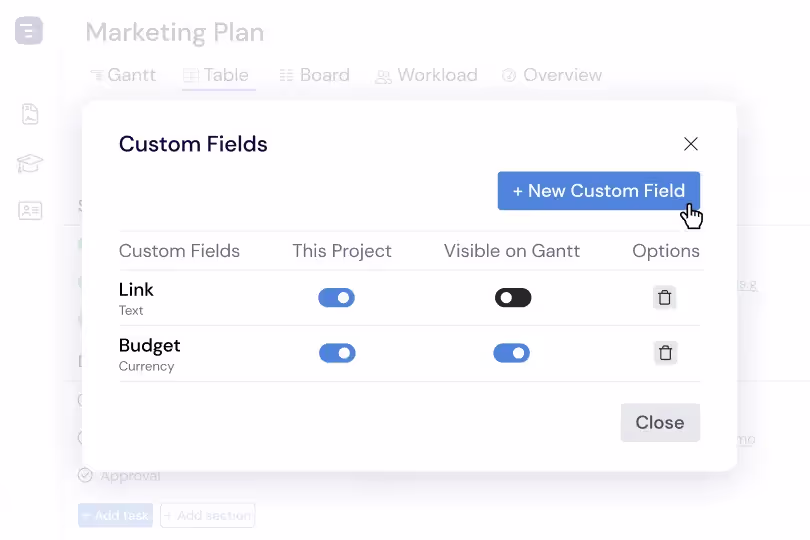
Custom Fields for Engineering Data
Add custom fields to capture engineering-specific data like story points, sprint velocity, code review status, deployment environment, feature flag state, and technical debt classification. Custom fields appear as sortable, filterable columns in the Table View, making it easy to analyze your engineering portfolio from multiple dimensions. Sort by story points to understand sprint capacity, filter by deployment status to track release readiness, or group by team to see workload distribution across engineering squads.