Dashboard
Status of All Your Projects at a Glance
Instagantt's Dashboard gives you a bird's-eye view of all your projects in one place. Track progress percentages, upcoming deadlines, budget consumption, and team workload across your entire portfolio without switching between individual Gantt charts. Whether you manage three projects or thirty, you stay informed and in control.

Trusted by 25,000+ Teams across the Globe
View Projects Across Time
See every project plotted on a unified timeline that reveals how your portfolio flows across weeks and months. Identify overlapping schedules that create resource conflicts, spot gaps between projects where team capacity could be better utilized, and understand the overall rhythm of your organization's project delivery. The timeline view makes it immediately obvious when multiple projects are competing for the same resources or when a delay in one project will cascade into others.

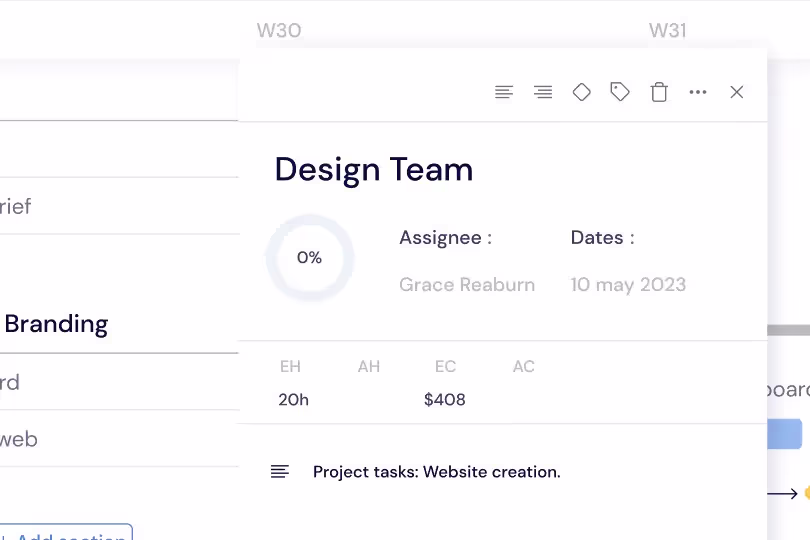
Track Costs and Hours at a Glance
Monitor estimated versus actual hours and budget consumption per project with clear visual indicators. Each project shows a progress bar comparing planned spending to actual spending, highlighting projects that are approaching their budget limits. This financial visibility helps project managers and executives course-correct before overruns happen, make informed decisions about scope adjustments, and allocate remaining budget to the highest-impact activities.
Assess Priorities and Risks Instantly
Surface high-risk projects with color-coded health scores and priority rankings that make it easy to identify where attention is needed. Critical path delays, overdue milestones, and at-risk deliverables are flagged automatically so nothing slips through the cracks. The risk assessment view helps managers focus their time on the projects and tasks that pose the greatest threat to on-time delivery rather than spreading attention equally across all projects.

Align Outcomes with Expectations
Compare baseline plans against actual progress across your entire portfolio to understand schedule variance at the highest level. See which projects are ahead of schedule, which are tracking to plan, and which have fallen behind. This plan-versus-actual comparison gives you the data to communicate status to stakeholders with confidence, justify resource requests with evidence, and identify systemic planning issues that affect multiple projects.
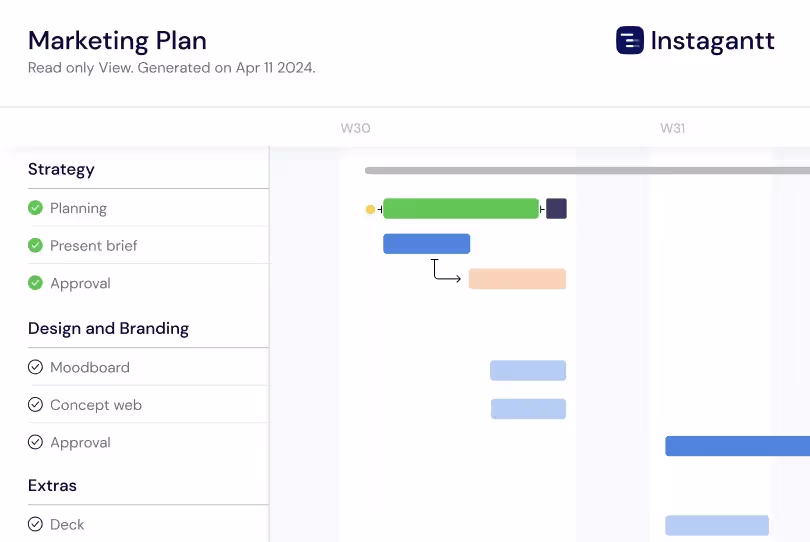
Cross-project Timeline
See every current and upcoming project on one cross-project timeline that shows what is due this week, month, or quarter. The cross-project timeline surfaces scheduling conflicts — when multiple projects have deliverables landing the same week, you can prioritize resources and adjust timelines before deadlines slip. This consolidated Gantt view helps portfolio managers coordinate deliverables across simultaneous projects and communicate upcoming commitments to stakeholders at a glance.
Executive Summary View
Generate a high-level executive summary that distills your entire portfolio into key metrics and status indicators designed for leadership consumption. The summary shows total project count, on-track versus at-risk ratios, milestone completion rates, overall budget health, and team utilization averages. Executives can assess organizational project health in sixty seconds and drill down into specific projects only when the summary surfaces issues requiring their attention. Export the summary as a branded PDF for board meetings and quarterly reviews.
Key Capabilities
Everything you need, nothing you don't.
Portfolio Overview
See all projects with progress bars, status indicators, and health scores displayed in a clean, scannable layout. Each project shows its completion percentage, timeline status, and overall health so you can immediately identify which projects are on track and which need attention. Sort and filter by status, deadline, or team to focus on the projects and metrics that matter most to you.
Budget Tracking
Monitor costs versus budget across all projects with visual indicators that highlight spending trends and potential overruns. See estimated versus actual hours at both the project and task level. Color-coded warnings flag projects approaching their budget limits so you can course-correct before costs spiral out of control.
Cross-project Tracking
Track past, current, and upcoming projects across your entire portfolio in one consolidated view. See which deadlines are approaching, which finished on time, and which are at risk from upstream delays. This cross-project tracking is essential for coordinating releases, deliverables, and launch events that span multiple projects or teams from a single Dashboard.
Progress Tracking
Get a clear view of how your projects are progressing without digging into details. The Instagantt Dashboard compares actual progress against planned timelines at a glance, so you can spot delays, flag risks early, and take action before small slippages turn into missed deadlines or scope overruns.
Adjustable timeline
View your projects from the timeline scale that fits your planning needs. Switch instantly between weekly, monthly, quarterly, and yearly views on the Dashboard to balance short-term execution with long-term strategy, all from one flexible, zoomable project timeline.
Quick comparisons
Stay in control of multiple projects by comparing their key metrics side by side. The Dashboard lets you evaluate costs, tracked hours, and overall progress across your portfolio at a glance, giving you a clear picture of project health so you can prioritize, adjust plans, and decide faster.
Explore More Features
Discover everything Instagantt has to offer for your project management workflow.