Gantt Chart View
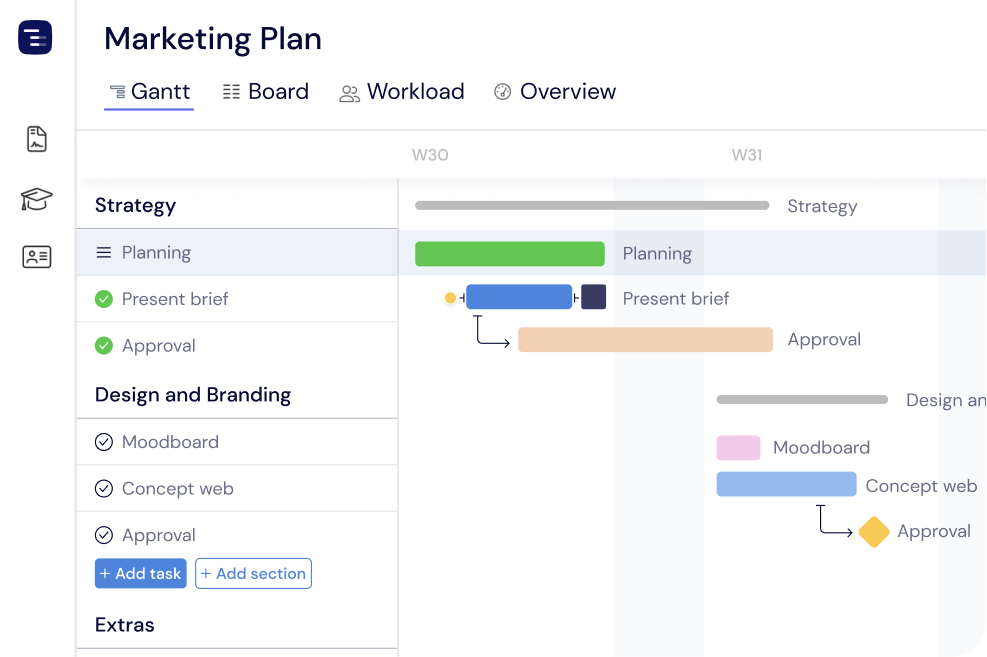
The Gantt Chart Software Built for How Modern Teams Plan
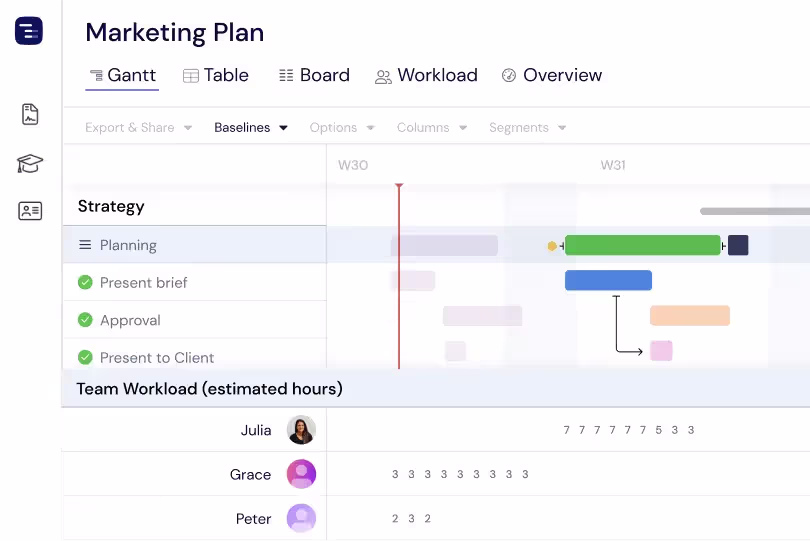
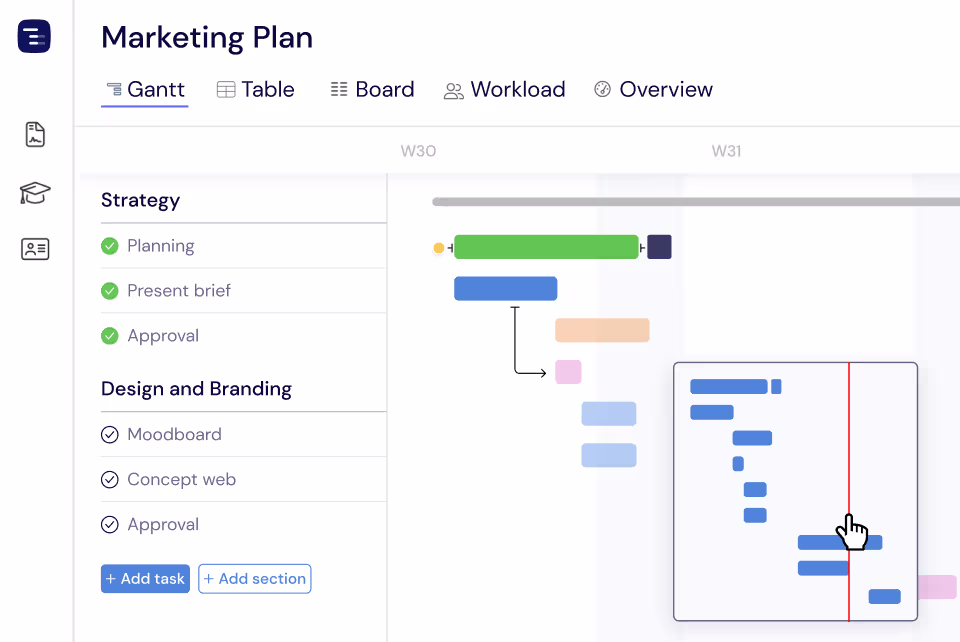
Instagantt is online gantt chart software with a Gantt Chart View that turns every project into an interactive visual timeline. As a browser-based gantt maker, this gantt software requires zero installation — see every task, dependency, milestone, and team assignment at a glance. Drag and drop to schedule, resize bars to adjust durations, and link tasks with dependencies to keep your project plan updating in real time. Whether you are running a two-week sprint or a multi-year program, Instagantt's gantt chart software scales with your team.
Trusted by 25,000+ Teams across the Globe
Suitable for Projects of Any Size
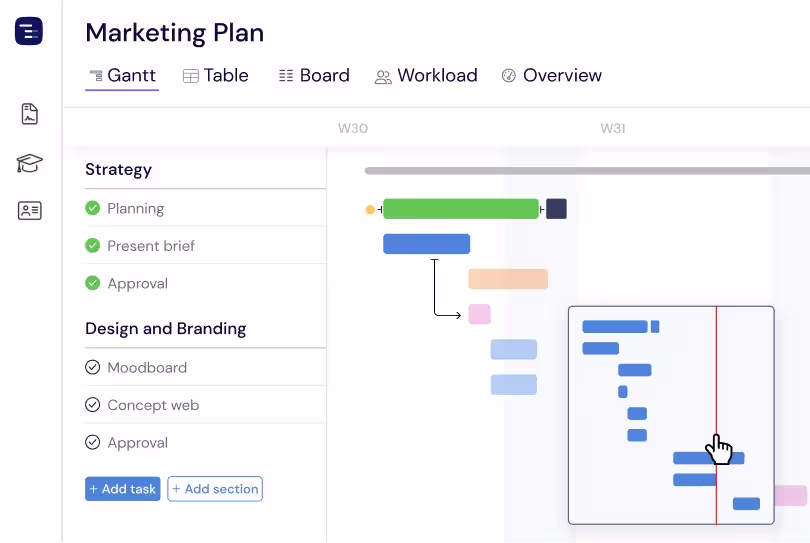
Whether you are managing a small team sprint with twenty tasks or a complex multi-year program with hundreds of deliverables, Instagantt handles it smoothly. The minimap navigation provides a bird's-eye view of your entire timeline, letting you zoom in on details or zoom out for the big picture. Click anywhere on the minimap to instantly navigate to that section of your project. Large projects remain fast and responsive thanks to optimized rendering.
Easy Sharing
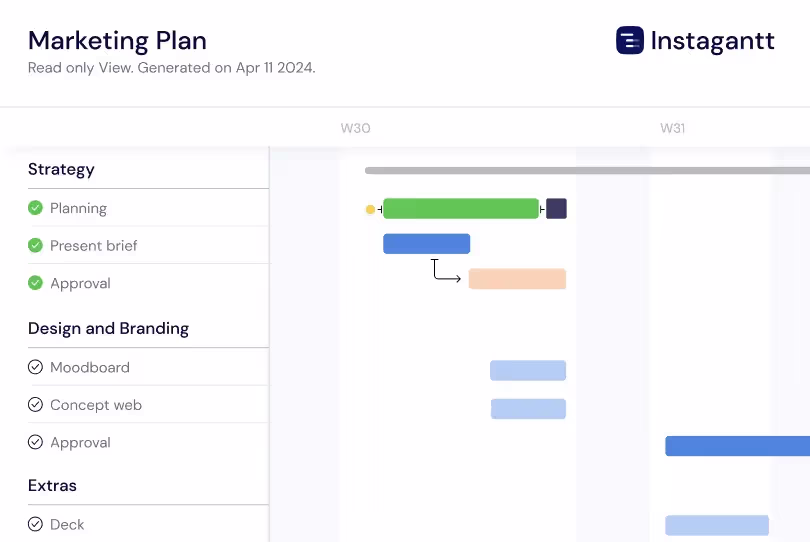
Export your Gantt charts as beautiful high-resolution images, professional PDFs, or detailed spreadsheets with a single click. Share project timelines with stakeholders, clients, or team members who do not have an Instagantt account. Public Snapshot URLs generate live, read-only views of your project that update automatically, eliminating the need to re-export and re-send every time your schedule changes.
Real-Time Team Collaboration
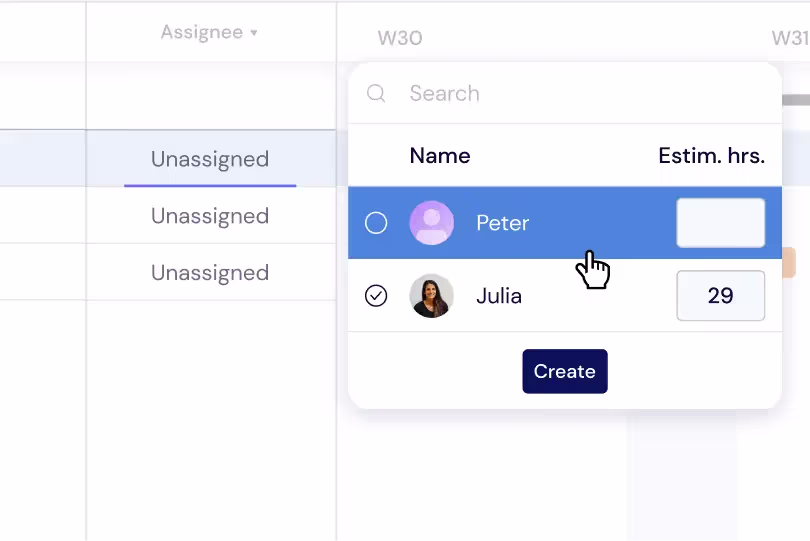
Assign tasks to team members and see who is working on what in real time. Each team member's avatar appears on their assigned tasks, providing clear visual ownership across the entire project. When someone updates a task's progress, dates, or status, the change appears immediately for everyone viewing the project. This real-time collaboration eliminates version confusion and keeps the whole team aligned.
Optimize Resource Efficiency
Visualize your team's workload directly on the Gantt chart with color-coded indicators that show each person's utilization level. Spot overallocated team members at a glance and rebalance work by dragging tasks between assignees. Switch to the dedicated Workload View for a comprehensive dashboard that makes it easy to manage capacity across all active projects simultaneously.
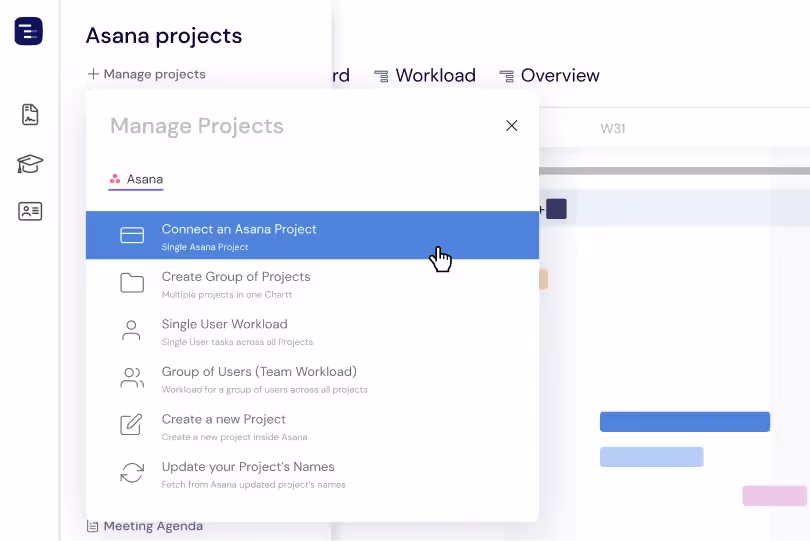
Swift Asana Integration
Sync your Asana projects into Instagantt in seconds with a single click, using the Instagantt for Asana version. Tasks, sections, subtasks, assignees, due dates, and supported custom fields flow in automatically — no manual setup required. Updates made in Asana are reflected in Instagantt, keeping your Gantt timeline aligned as your team works. Your team keeps using Asana as usual while you gain powerful Gantt chart capabilities for planning, tracking, and stakeholder visualization.
Easy to Learn. Easy to Use
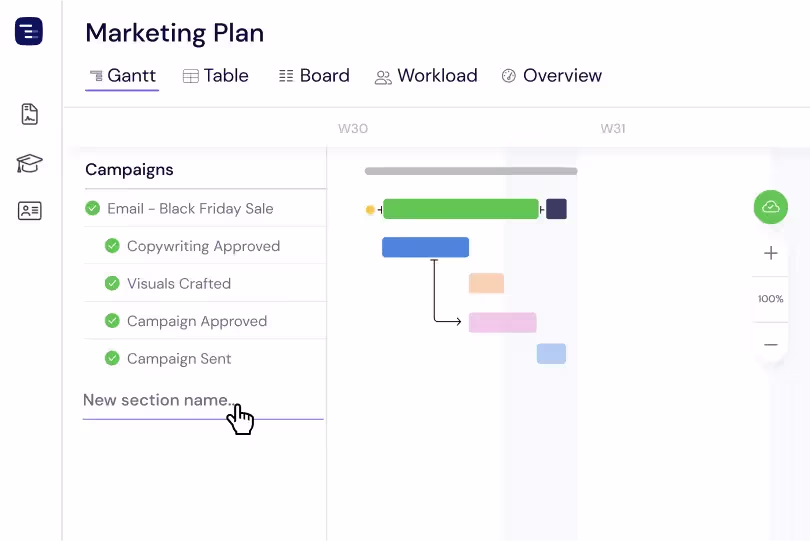
Organize your project into clear sections, add tasks with dates, and start building your Gantt chart in minutes — not days. Instagantt's clean, intuitive interface means your team can be productive from day one without training sessions or tutorials. The learning curve is minimal because the interactions feel natural — drag to schedule, click to edit, draw to create dependencies.
Critical Path Analysis
Enable critical path highlighting to instantly see the longest chain of dependent tasks that determines your project's earliest possible completion date. The critical path is highlighted in a distinct color on your Gantt chart, making it clear which tasks cannot be delayed without extending the project deadline. Focus your management attention and your team resources on critical path tasks — any delay in these tasks directly delays the entire project. Non-critical tasks have float time that allows some schedule flexibility without affecting the final delivery date.
Customizable Timeline Appearance
Customize how your Gantt chart looks and navigates to fit different planning needs. Switch the timeline scale between days and weeks for either a detailed or a high-level view, apply color coding to task bars using options beyond the default blue, green, and red, and collapse or expand sections and tasks to move between aggregated and detailed perspectives. These flexible Gantt view settings let you tailor the same project data for focused execution and for broader, stakeholder-ready planning presentations.
Key Capabilities
Everything you need, nothing you don't.
Drag & Drop Scheduling
Drag task bars to change dates, resize to change duration, and drop to reorder tasks within sections. The drag-and-drop interface makes scheduling feel natural and immediate — no forms or dialogs required. When you move a task, dependent tasks cascade automatically so your timeline always reflects realistic scheduling.
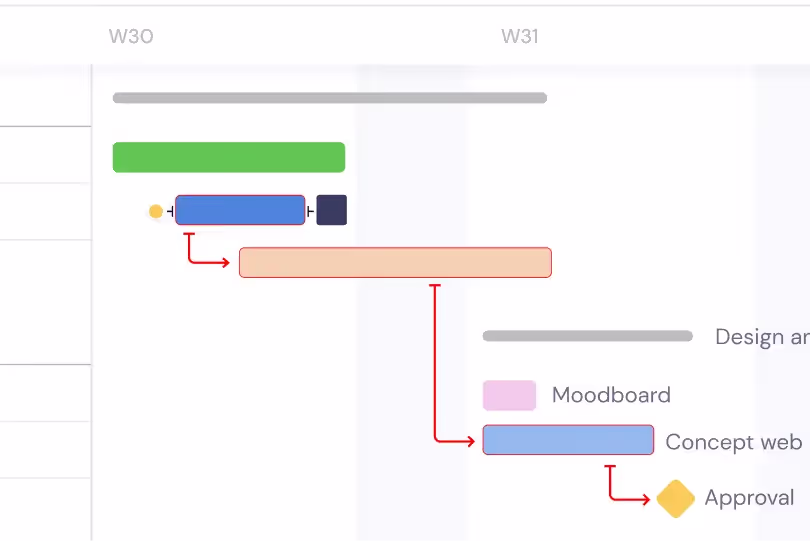
Dependencies
Link tasks with finish-to-start dependencies and visualize the relationships as arrows on your Gantt chart. Dependencies ensure tasks happen in the right order and schedule changes cascade properly. Enable critical path highlighting to see which chain of tasks determines your project's minimum completion time.
Color-Coded Bars
Assign colors to task bars by section, priority, status, or any custom attribute for instant visual identification. Color coding turns your Gantt chart into a scannable map where you can immediately identify task categories, priority levels, and project phases without reading individual task details.
Progress Tracking
See task completion as a filled overlay on each bar that shows the percentage of work completed. Track progress at a glance across your entire project — green means on track, and you can quickly spot tasks that are behind schedule by comparing the progress fill to the current date position on the timeline. This visual progress indicator works across all zoom levels for consistent tracking.
Zoom Levels
Switch between day, week, month, and quarter zoom levels to see the right level of detail for your current need. Zoom into daily detail when scheduling a sprint, or zoom out to a quarterly view when presenting a roadmap to stakeholders. Each zoom level maintains the same visual clarity and interactive capabilities across all views.
Baselines
Create baseline snapshots of your project plan at any point in time and compare the original plan against actual progress side by side. Baselines make schedule drift visible by showing how your current timeline compares to what was originally planned, helping you communicate scope changes and schedule variance to stakeholders with concrete visual evidence.
Explore More Features
Discover everything Instagantt has to offer for your project management workflow.
What is Gantt chart software?
Gantt chart software is a visual project management tool that displays tasks as horizontal bars on a timeline, showing each task's start date, duration, end date, and dependencies. Modern gantt chart software like Instagantt is browser-based, supports drag-and-drop scheduling, automatically cascades dependent tasks when dates change, highlights the critical path, and lets teams collaborate on a shared timeline in real time. It replaces static spreadsheet schedules with an interactive plan that updates as work happens.