Reporting
Export in JPEG, PDF & Others
Instagantt's reporting tools let you share project timelines with stakeholders through multiple formats. Export Gantt charts as high-resolution PDFs, PNG images, or CSV spreadsheets, or generate live public snapshot URLs that update automatically as your project evolves. Professional reports in seconds.
Trusted by 25,000+ Teams across the Globe
Public Snapshots
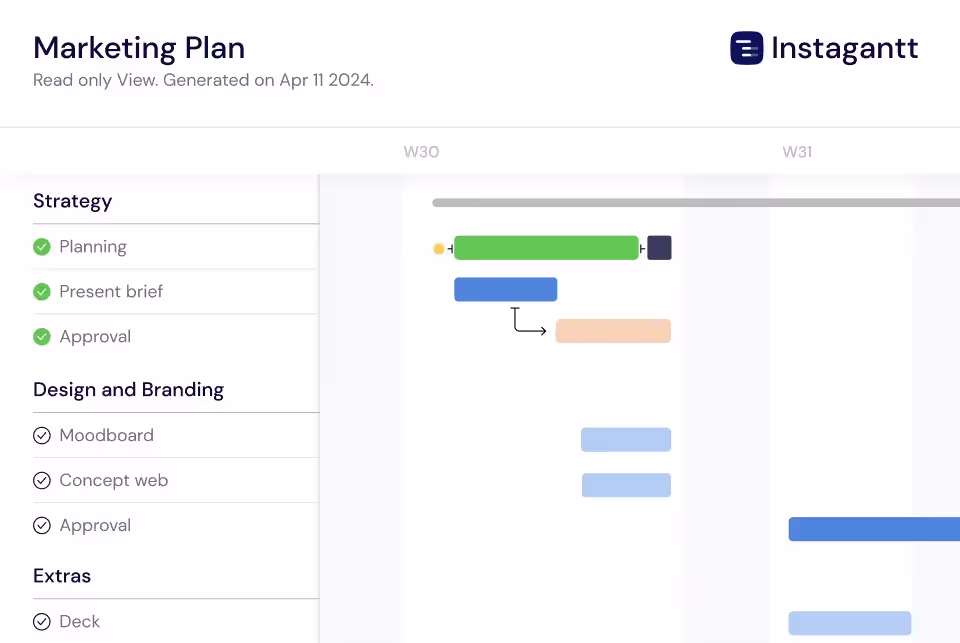
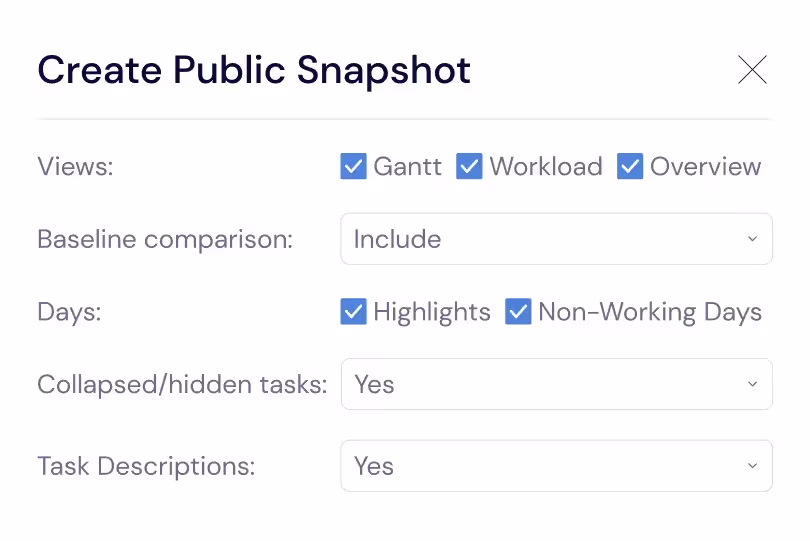
Generate shareable URLs for live, read-only views of your Gantt chart that anyone can access without an Instagantt account. Public snapshots are perfect for sharing project status with clients, executives, investors, and partners who need visibility into your project timeline. The snapshot updates automatically as your project evolves, eliminating the need to re-export and re-send reports every time your schedule changes. Stakeholders can check project status on their own schedule.
Export As Spreadsheet
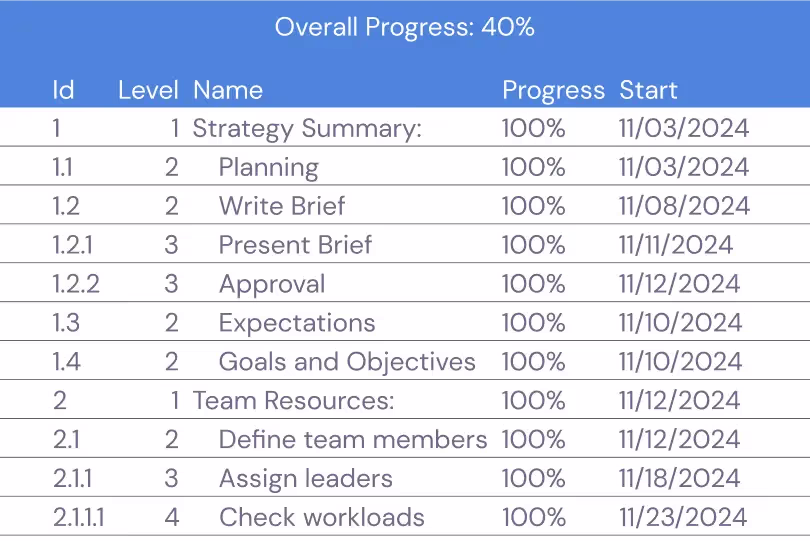
Export all your project data to spreadsheets for detailed analysis, custom reporting, financial reconciliation, or long-term archiving. The spreadsheet export includes every task field — names, dates, durations, assignees, progress percentages, custom field values, and dependency relationships. This comprehensive data export gives you complete portability and makes it easy to create custom reports in Excel or Google Sheets.
PDF and Image Exports
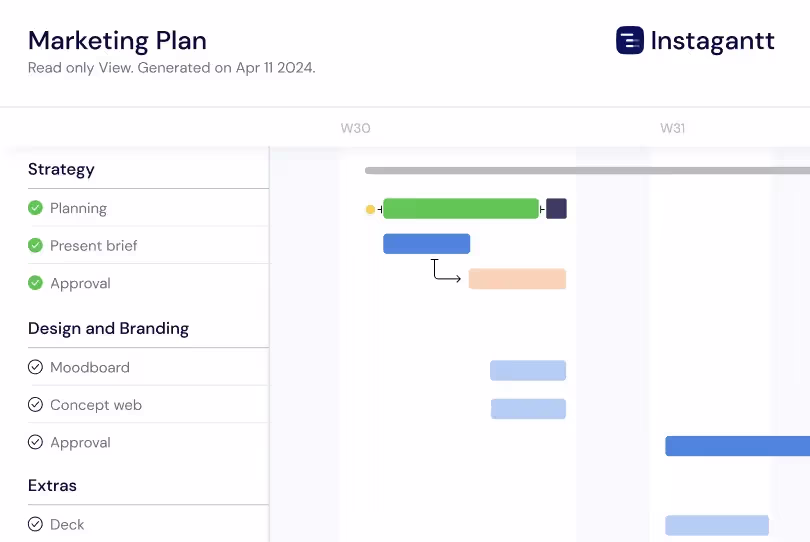
Export your Gantt charts as high-resolution PDFs or JPEG images that are ready for professional presentations, printed handouts, and stakeholder communications. The visual export captures your timeline with full color coding, progress indicators, dependency arrows, and milestone markers. Choose between compact and detailed layouts to match your audience — executive summaries for leadership and detailed views for project teams.
Branded Reports for Clients
Add your company logo to every export — PDFs, images, and Public Snapshots — to create clean, professional reports that represent your organization. Every shared timeline or project view carries your brand identity automatically, with zero manual formatting. Branded exports are especially useful for consulting firms, agencies, and service providers, helping you present project information consistently and professionally across all client and stakeholder communications.
Data-Rich Spreadsheet Exports
Export your complete project data as spreadsheets that include every task field — names, dates, durations, assignees, progress percentages, custom field values, and cost data. The spreadsheet export is invaluable for financial reconciliation, time tracking analysis, resource utilization reporting, and integration with business intelligence platforms. Use the exported data to build custom charts, pivot tables, and dashboards that go further than any single project management tool can offer on its own.
Print-Ready Gantt Charts
Generate print-optimized Gantt chart layouts that look professional on paper at any size from letter to large-format poster prints. The print layout automatically adjusts text size, bar proportions, and legend placement to ensure readability at the chosen paper size. Print your Gantt chart for conference room walls, project war rooms, and team workspaces where a physical timeline reference helps keep everyone focused on the project schedule. The print-ready output includes page numbers, project title, date range, and legend for complete context on every printed page.
Comparison Reports with Baselines
Generate visual comparison reports that show your original baseline plan alongside current progress, making schedule variance immediately visible. Comparison reports highlight tasks that started late, tasks that are taking longer than planned, and tasks that were added after the baseline was created. These plan-versus-actual reports are essential for project retrospectives, client status updates, and stakeholder meetings where you need to explain what changed and why. Export comparison reports as PDFs that include both the timeline visualization and a tabular summary of variance metrics.
Key Capabilities
Everything you need, nothing you don't.
PDF Export
Export your Gantt chart as a high-resolution PDF with professional formatting that is ready for client presentations, board meetings, and stakeholder updates. PDFs include task names, dates, progress indicators, and dependency arrows in a clean, printable layout. Add your company logo and branding to create reports that represent your organization professionally.
JPEG Export
Export your Gantt chart as a high-resolution JPEG image that can be inserted into slide decks, documents, wiki pages, or email updates. The image export captures the full timeline with all task details, color coding, and progress indicators visible. Choose the resolution and zoom level to get exactly the right level of detail for your audience.
Spreadsheet Export
Export all your task data as a spreadsheet file for use in Excel, Google Sheets, or any reporting tool. The export includes key task fields — names, dates, assignees, progress, and custom fields — giving you a complete, portable view of your project data. Use spreadsheet exports for reporting, deeper analysis, or integration with business intelligence tools.
Public Snapshots
Generate shareable URLs that give anyone a live, read-only view of your Gantt chart without requiring an account or login. Public snapshots update automatically as your project changes, so stakeholders always see the current plan. Share snapshots with clients for progress visibility, with executives for portfolio reviews, or with partners for coordination.
Custom Branding
Add your company logo to exported PDFs, images, and Public Snapshots to create professional reports that represent your organization. Branded exports are essential for consulting firms, agencies, and service providers who share project timelines with clients. Every report looks polished and on-brand with zero manual formatting work.
Baseline comparison
Compare your project's current timeline against any saved baseline right on the Gantt chart. Each baseline appears as a reference line alongside your live schedule, making it easy to visualize how the plan has shifted over time. Baseline comparison is especially useful for reporting, helping you clearly communicate schedule changes and project evolution in a simple, visual way.
Explore More Features
Discover everything Instagantt has to offer for your project management workflow.