Dashboard (Beta)
The Instagantt project Dashboard gives you a powerful, high-level overview of every project in your workbook. It centralizes key performance metrics, helping you track progress, identify delays, and compare expected vs. actual performance—all in one visual interface.
🧭 Table of Contents
- What Is the Instagantt Project Dashboard?
- Why Use the Dashboard for Project Tracking?
- How to Access the Dashboard in Instagantt
- How to Refresh Dashboard Data
- Dashboard Key Features and Project Metrics
- How to Use the Dashboard to Analyze Project Health
- Pro Tips for Getting the Most Out of the Dashboard
- Frequently Asked Questions (FAQ)
💡 What Is the Instagantt Project Dashboard?
The Instagantt Project Dashboard is a centralized portfolio view that displays key performance metrics for all your projects in a single, easy-to-read interface.It provides instant visibility into project health, highlighting total project costs, total hours, priority and risk levels and progress percentage, making it really easy to view the planned vs. actual performance.
The Dashboard is designed for project managers, team leads, and executives who need fast, accurate insights across multiple. With clear indicators showing whether a project is on time, delayed, or completed, the Dashboard gives you an immediate understanding of overall performance—without having to open each project individually.This makes the Dashboard an essential tool for project portfolio management, strategic planning, and real-time progress monitoring.
🎯 Why Use the Dashboard for Project Tracking?
The Dashboard helps teams visually assess project status, detect schedule delays, and evaluate risks across the entire portfolio. It enables instant comparisons of progress, cost, and hours, and it highlights deviations between current vs. expected outcomes.
This makes it a powerful tool for project managers, team leads, and executives who rely on fast, accurate insights for planning and decision-making. Whether you're managing two projects or fifty, the Dashboard gives you an immediate understanding of your entire workload.
🛠️ How to Access the Dashboard in Instagantt
- Open the left sidebar.
- Click Dashboard.
- Wait for it to load.
⏳ Please note: First-time loading may take longer as Instagantt processes data from all projects.

🔁 How to Refresh Dashboard Data
To optimize performance, the Dashboard does not auto-update. To refresh project data to the latest version click the Update button at the top of the Dashboard. Instagantt will reload all project metrics and display real-time numbers.
Updating before meetings or reviews ensures you’re working with the most accurate data.
🧩 Dashboard Key Features and Project Metrics
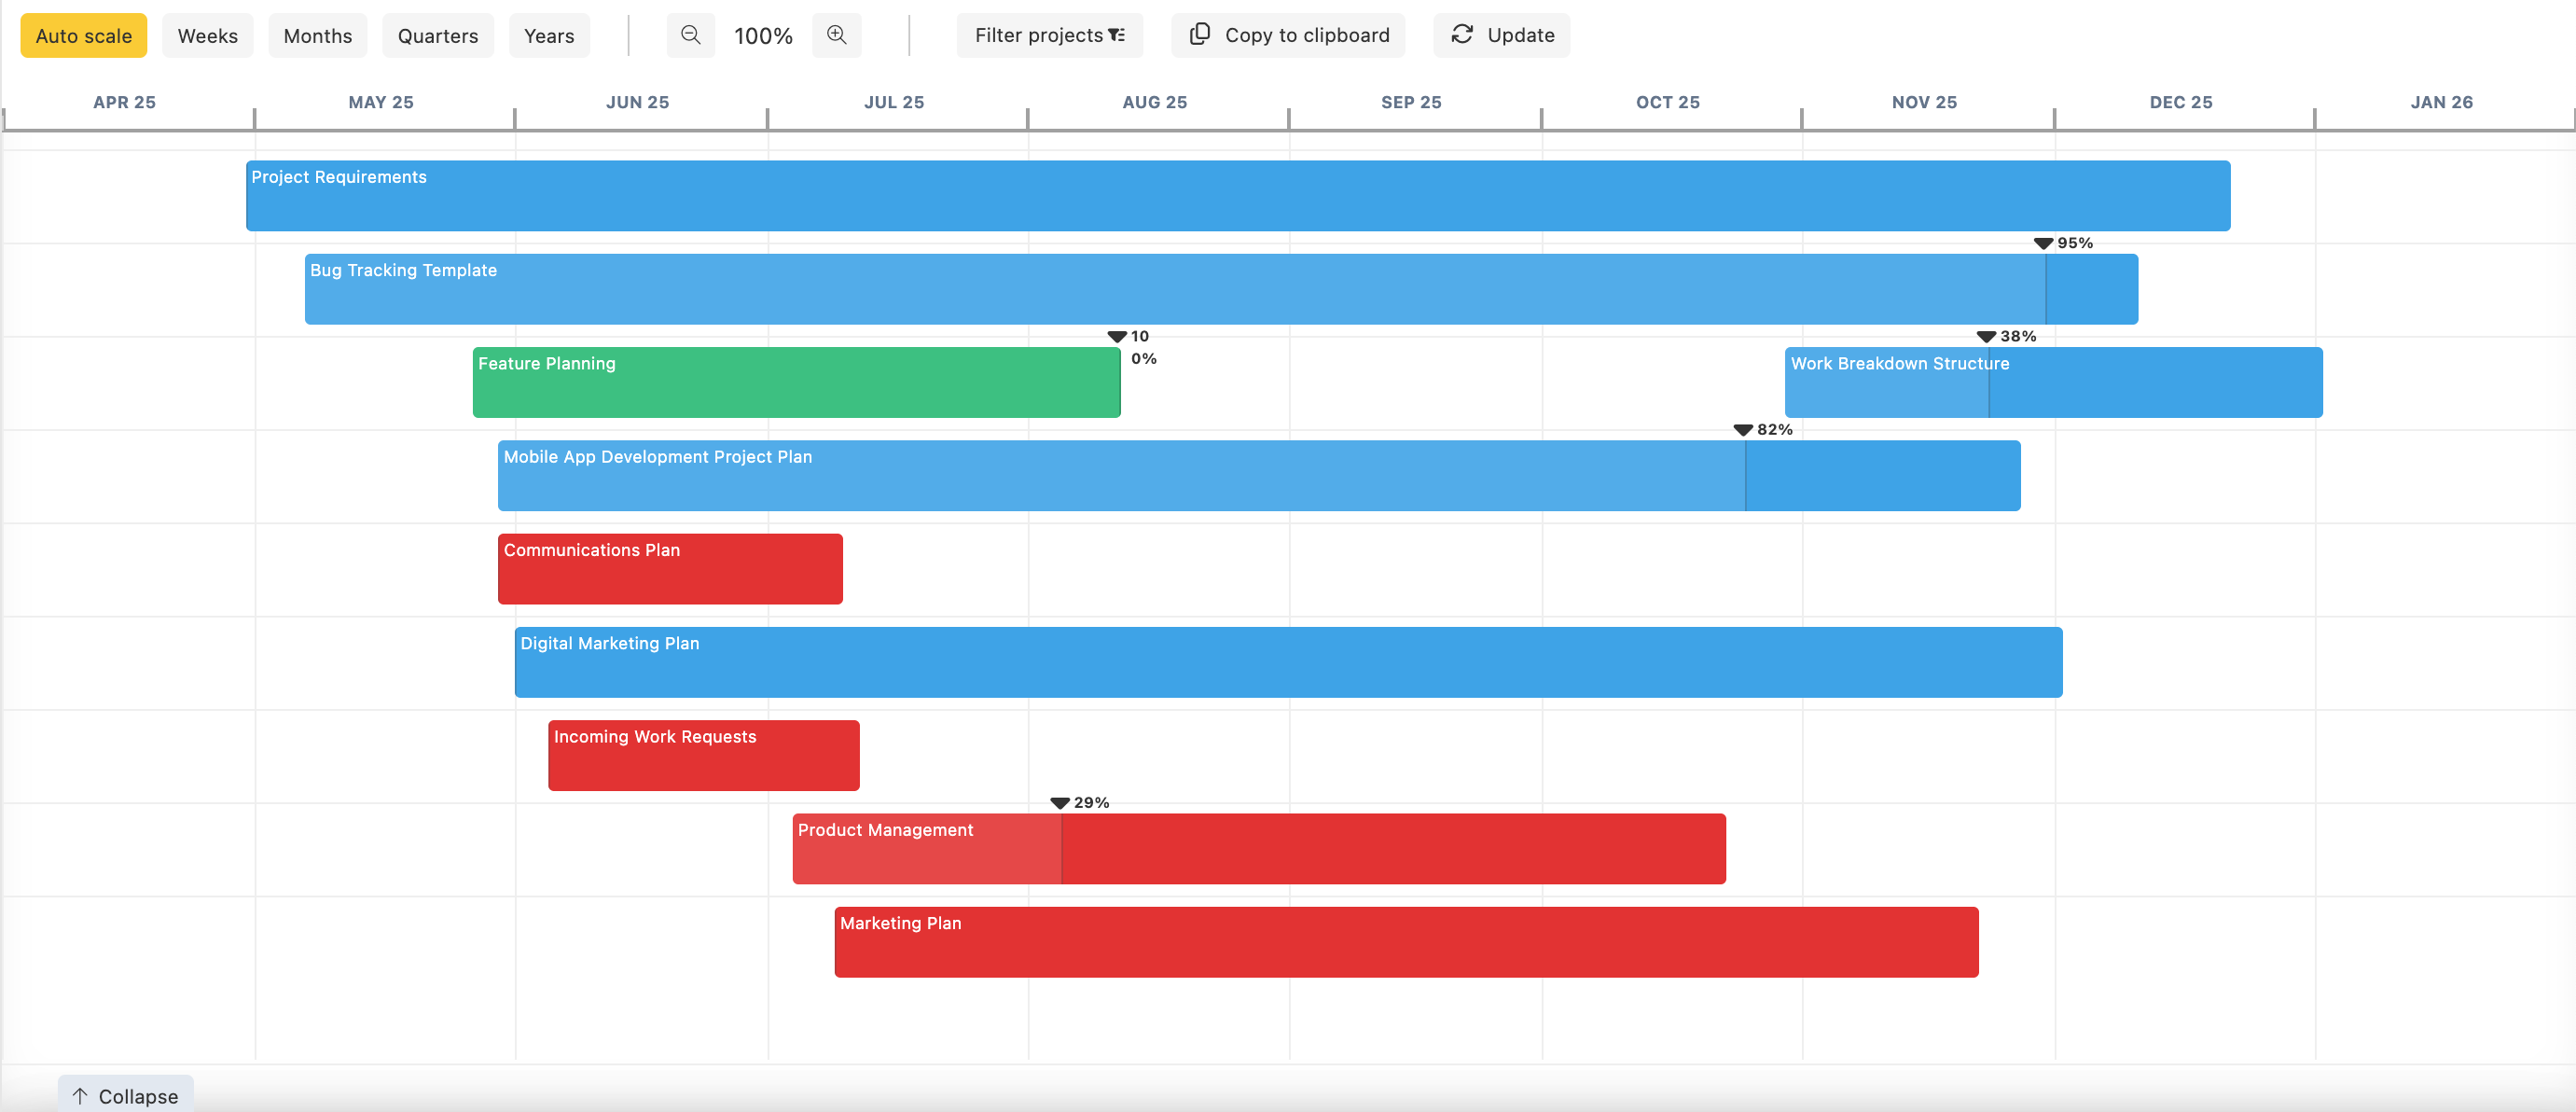
📅 Timeline Overview (Top Section)
The timeline visualizes each project as a bar, with colors indicating status:
- Red → Project overdue
- Blue → Project scheduled but not overdue
- Green → Project completed
Each bar includes a progress indicator, helping you instantly gauge how far along a project is compared to its schedule.
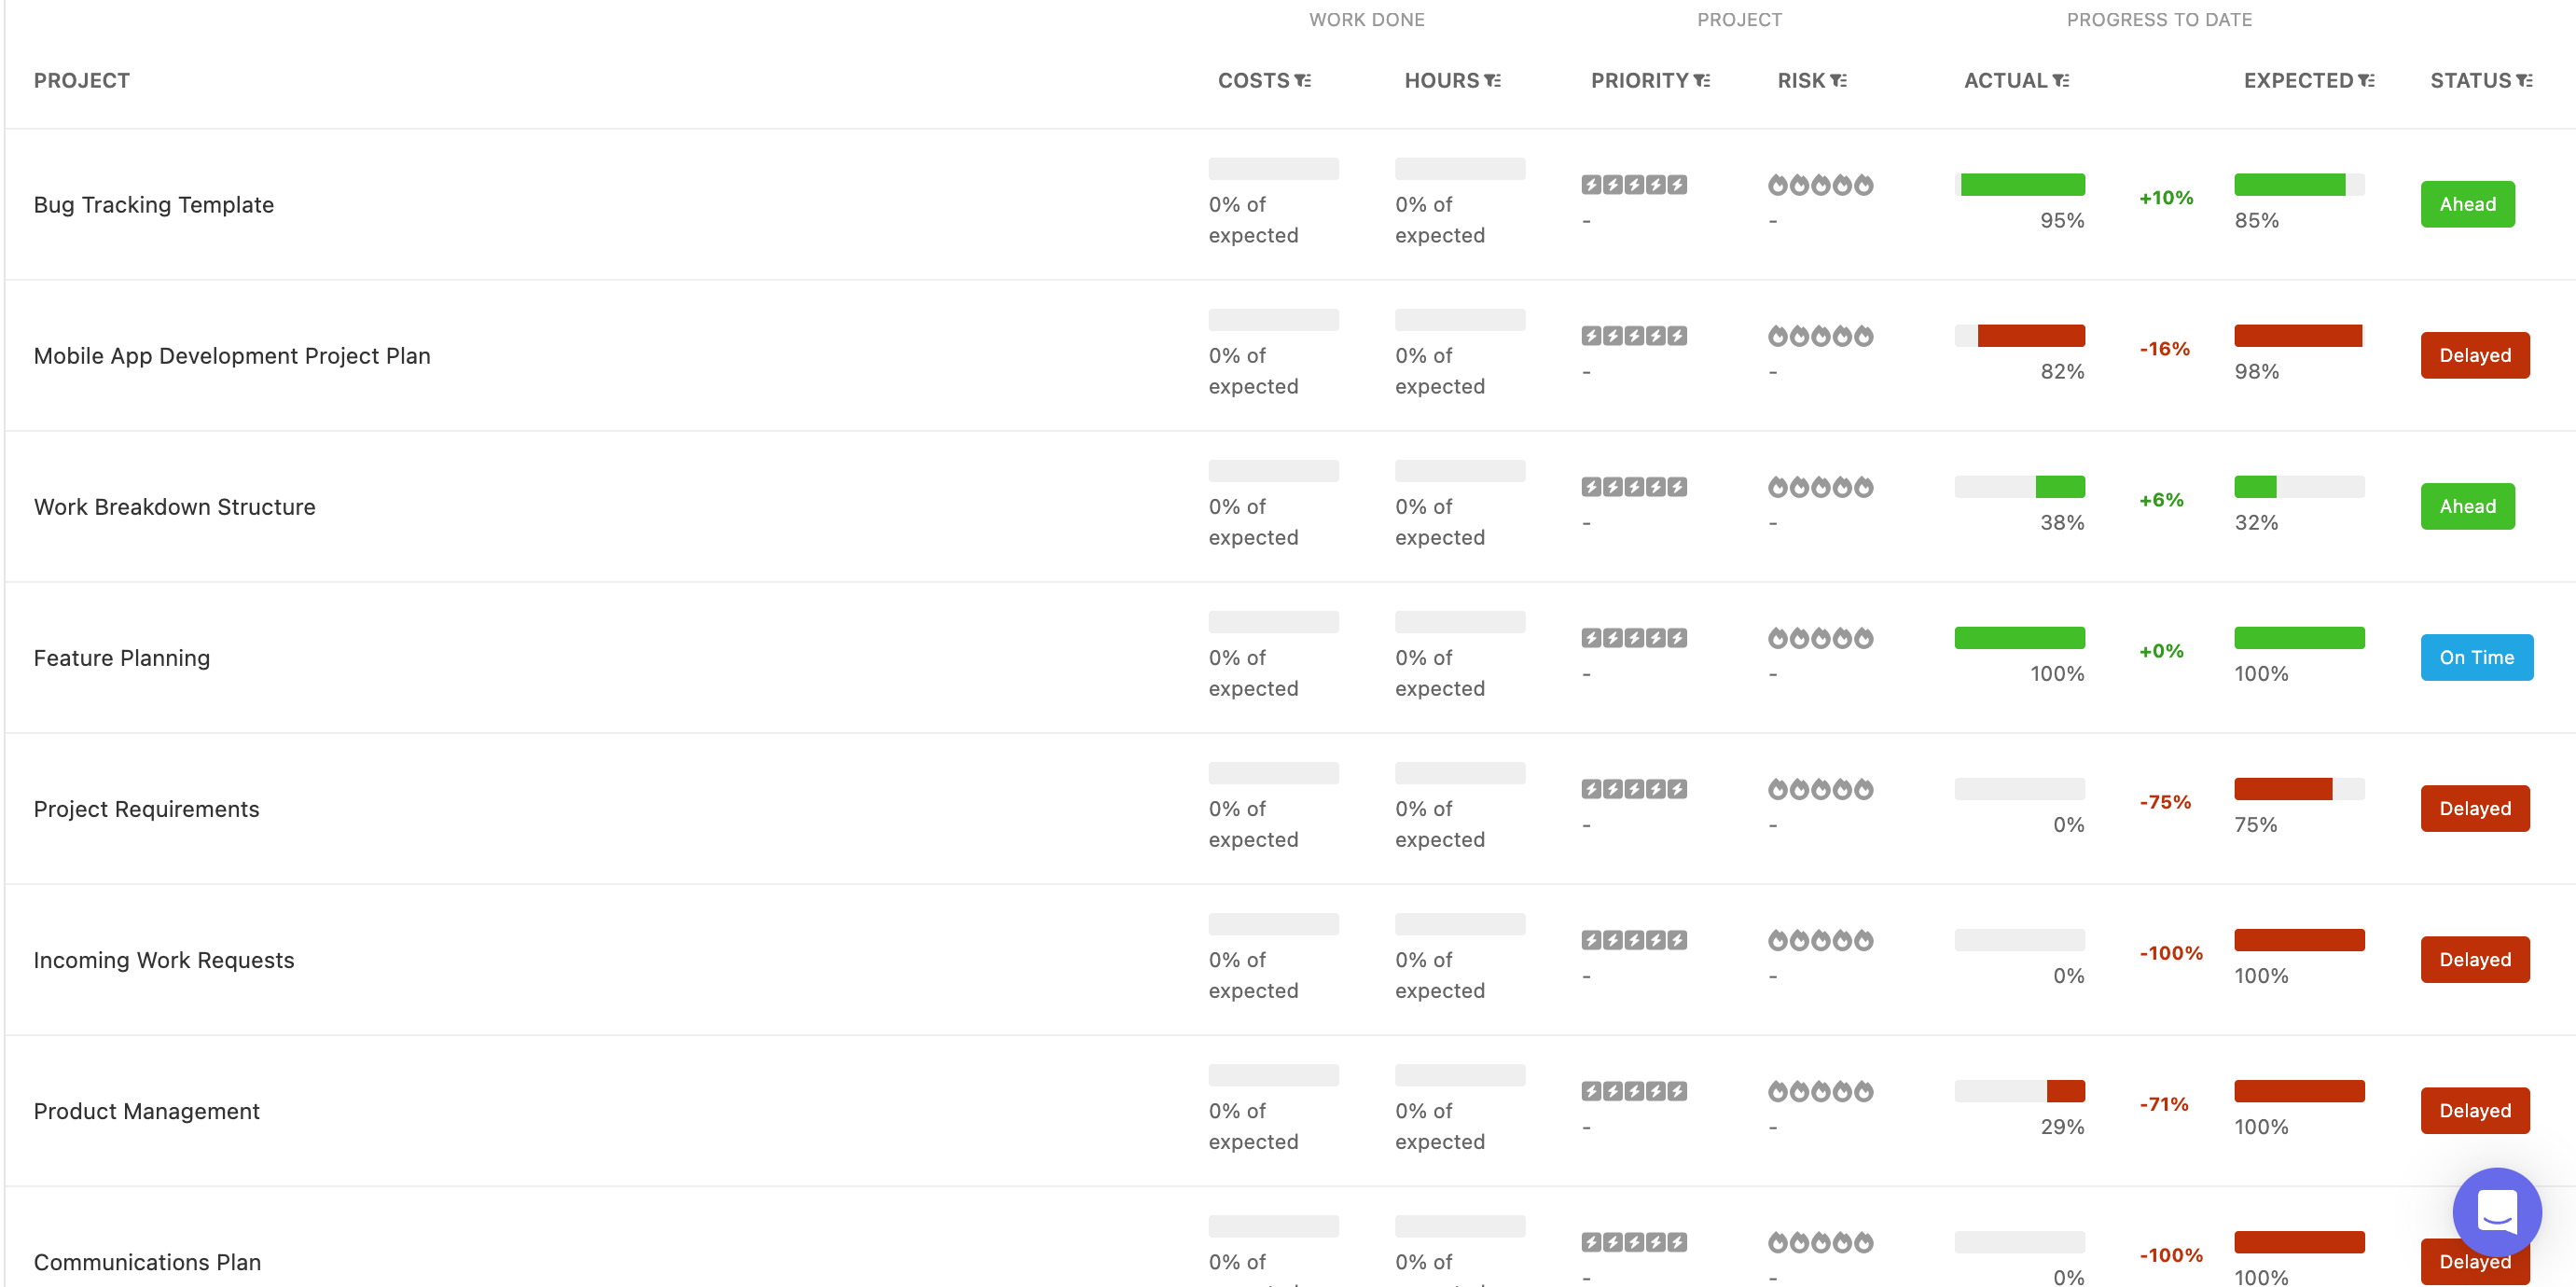
📋 Project List With Metrics (Bottom Section)
The bottom section displays a full list of projects, with key project metrics such as:
- Total cost
- Total planned and logged hours
- Priority level
- Risk level
- Progress percentage
- Expected vs. actual status
This area helps you compare projects quickly and efficiently—perfect for recurring check-ins or status reports. The color coding for the status of the projects in this section varies from the colors of the timeline bars:
- Red → Project delayed
- Blue → Project on time
- Green → Project ahead
🕒 Adjustable Timeline Scale
You can switch between multiple timeline scales: Auto Scale, Weekly, Monthly, Quarterly, and Yearly.Zooming controls allow you to expand or compress the timeline for more granular or broader overviews.
📈 Project Detail Panel
Clicking on any project opens a right-side detail panel, offering deeper insights including:
- Additional performance metrics
- Cost and hour breakdowns
- Detailed risk and priority info
- Progress comparison charts
This allows for deeper analysis without leaving the Dashboard summary.
📊 How to Use the Dashboard to Analyze Project Health
🔎 Read the Timeline View
In the Timeline View of your online Gantt chart software, you can quickly understand project status by checking the color-coded bars and the progress indicator inside each task. You can also adjust the scale or zoom to analyze both short-term and long-term performance, which is essential for efficient project management.
🗂 Use the Project List for Quick Comparisons
The Project List helps you compare costs, hours, risk, and priority across all your projects. It also lets you spot high-risk or high-cost items that may need attention. Reviewing planned vs. actual progress provides a clear view of deviations and overall project health.
📂 Open Project Details for Deeper Insights
By clicking any project, you can open its detail panel to access additional metrics without leaving the Dashboard. This gives you deeper insights for better decision-making and more accurate status updates, supporting a stronger project management workflow.
💡 Pro Tips for Getting the Most Out of the Dashboard
- Use the Dashboard as your daily project health check.
- Review quarter or year scale for long-term planning.
- Review week or auto scale for active execution phases.
- Always click Update before presenting data to stakeholders.
- Use zooming tools to review specific milestones or deadline clusters.
- Use the detail panel for investigating project overruns or risks.
📌 Summary
The Instagantt Dashboard gives you a clear, high-level view of your project health, helping you track progress, compare multiple projects, and dive into key metrics—all in one place. By combining the Timeline View, Project List, and Project Details, you can make faster, smarter decisions and stay on top of your entire project management workflow with ease.
🚀 Take Control of Your Project Health
Get a clearer, smarter overview of your work. Use your Dashboard to track project health, monitor progress, spot risks, and keep every project moving forward with confidence using online Gantt chart software.
❓ Frequently Asked Questions (FAQ)
Is the Project Dashboard available on all Instagantt versions?
No. It is only available on Instagantt Standalone.
Why does the Dashboard load slowly the first time?
It compiles data from all projects in your workbook, which requires additional processing time. To ramp up the speed, you can try loading the projects one by one first, then load the Dashboard.
Does the Dashboard auto-refresh?
No. You must click Update to get the latest information.
How many projects can I view in the Dashboard?
All projects within your current workbook are displayed.
Are the timeline colors customizable?
No. Colors are standardized to ensure consistent project status interpretation.