Workload View
🧭 Table of Contents
- What is Workload View in Instagantt?
- Why Workload Management Matters
- Key Features of Workload View
- What is the Team Workload Feature?
- How It Works
- Summary
- Frequently Asked Questions (FAQ)
💡 What is Workload View in Instagantt?
In project management, understanding how work is distributed across your team is essential to delivering successful outcomes. Workload View in Instagantt helps you monitor your team's capacity, prevent burnout, and ensure an even distribution of tasks across your projects.Whether you're managing a small team or coordinating a complex, multi-resource project, Workload View provides real-time visibility into task assignments and individual workloads.
👥 Why Workload Management Matters
Every project involves multiple tasks, deadlines, and—most importantly—people. Without proper workload tracking, some team members may become overwhelmed, while others may be underutilized. Both situations can lead to missed deadlines, decreased productivity, and poor morale.That’s where Instagantt’s Workload View comes in.
✅ Key Features of Workload View
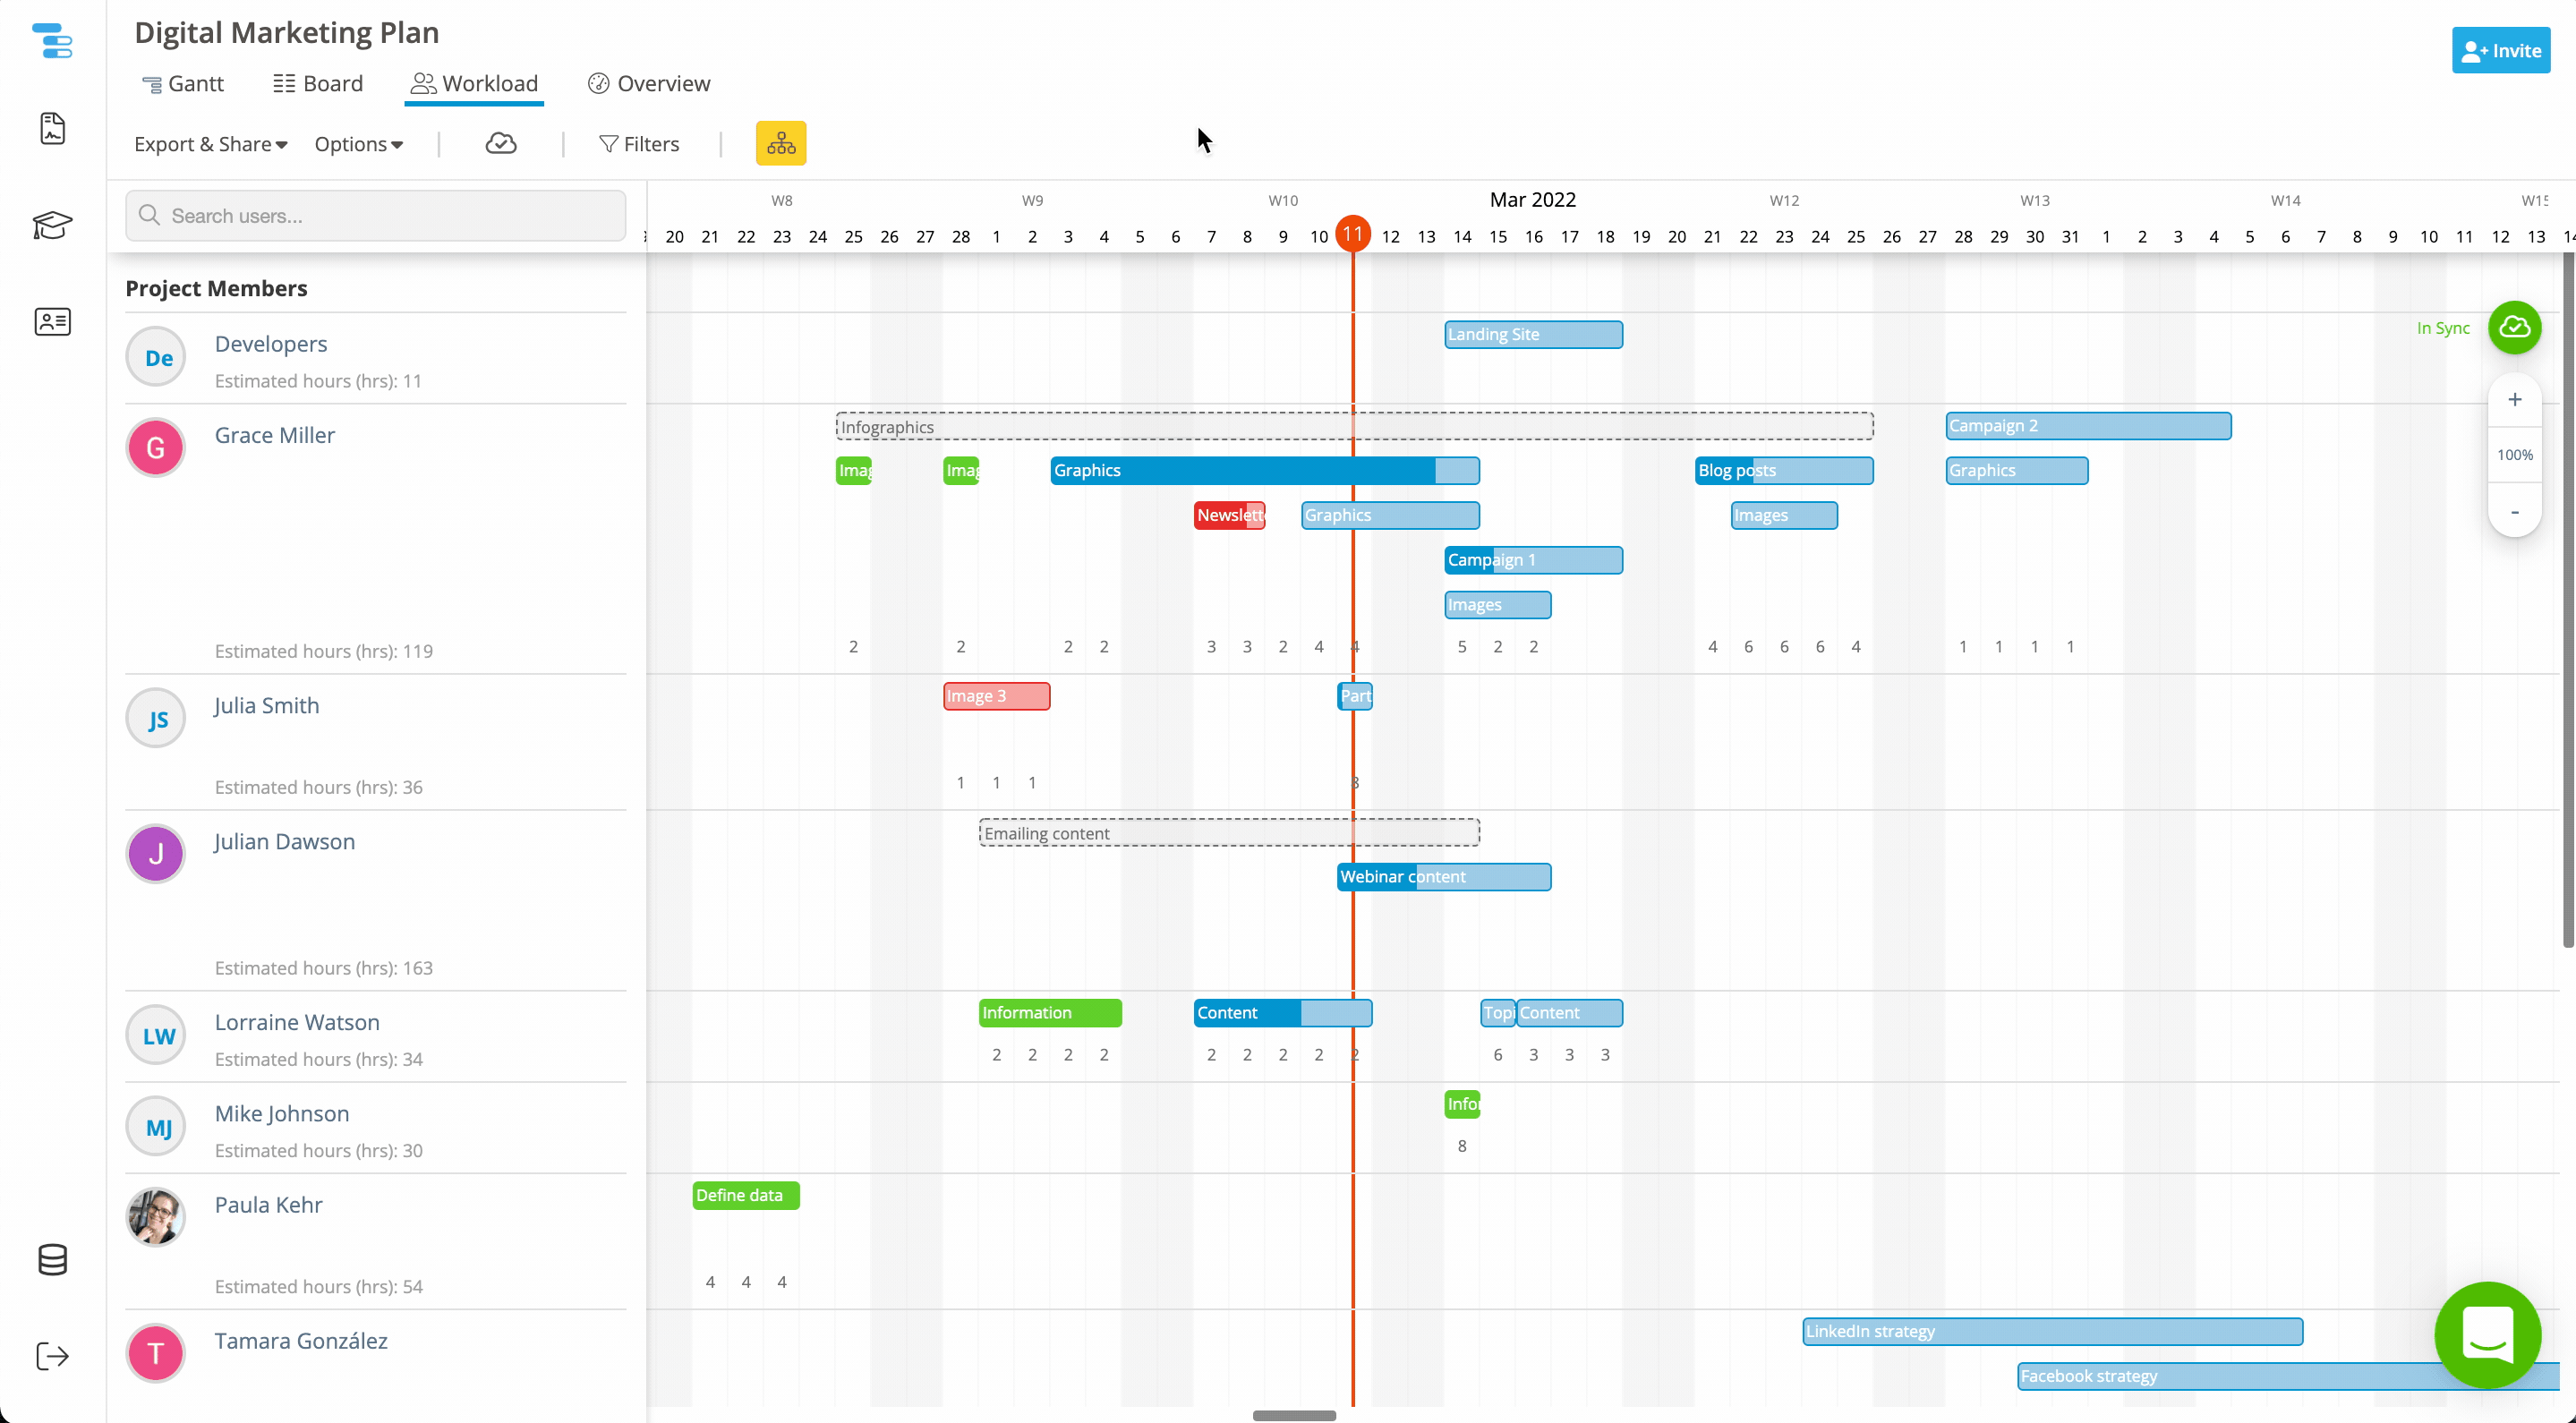
🧭 Visualize Team Workload at a GlanceWorkload View displays a detailed breakdown of how tasks are assigned across your team. You can instantly identify who is overbooked or underutilized, allowing you to adjust assignments accordingly.
⏱️ Track Estimated Hours vs. DurationWorkload calculations are based on each task’s Estimated Hours divided by its Duration. These values are summed across tasks to show a user’s total daily workload.
🚨 Color-Coded Overload WarningsIf a team member is overloaded on a specific day, their workload number will appear in red, signaling that their capacity has been exceeded. This makes it easy to spot bottlenecks and redistribute work.
🚀 What is the Team Workload Feature?
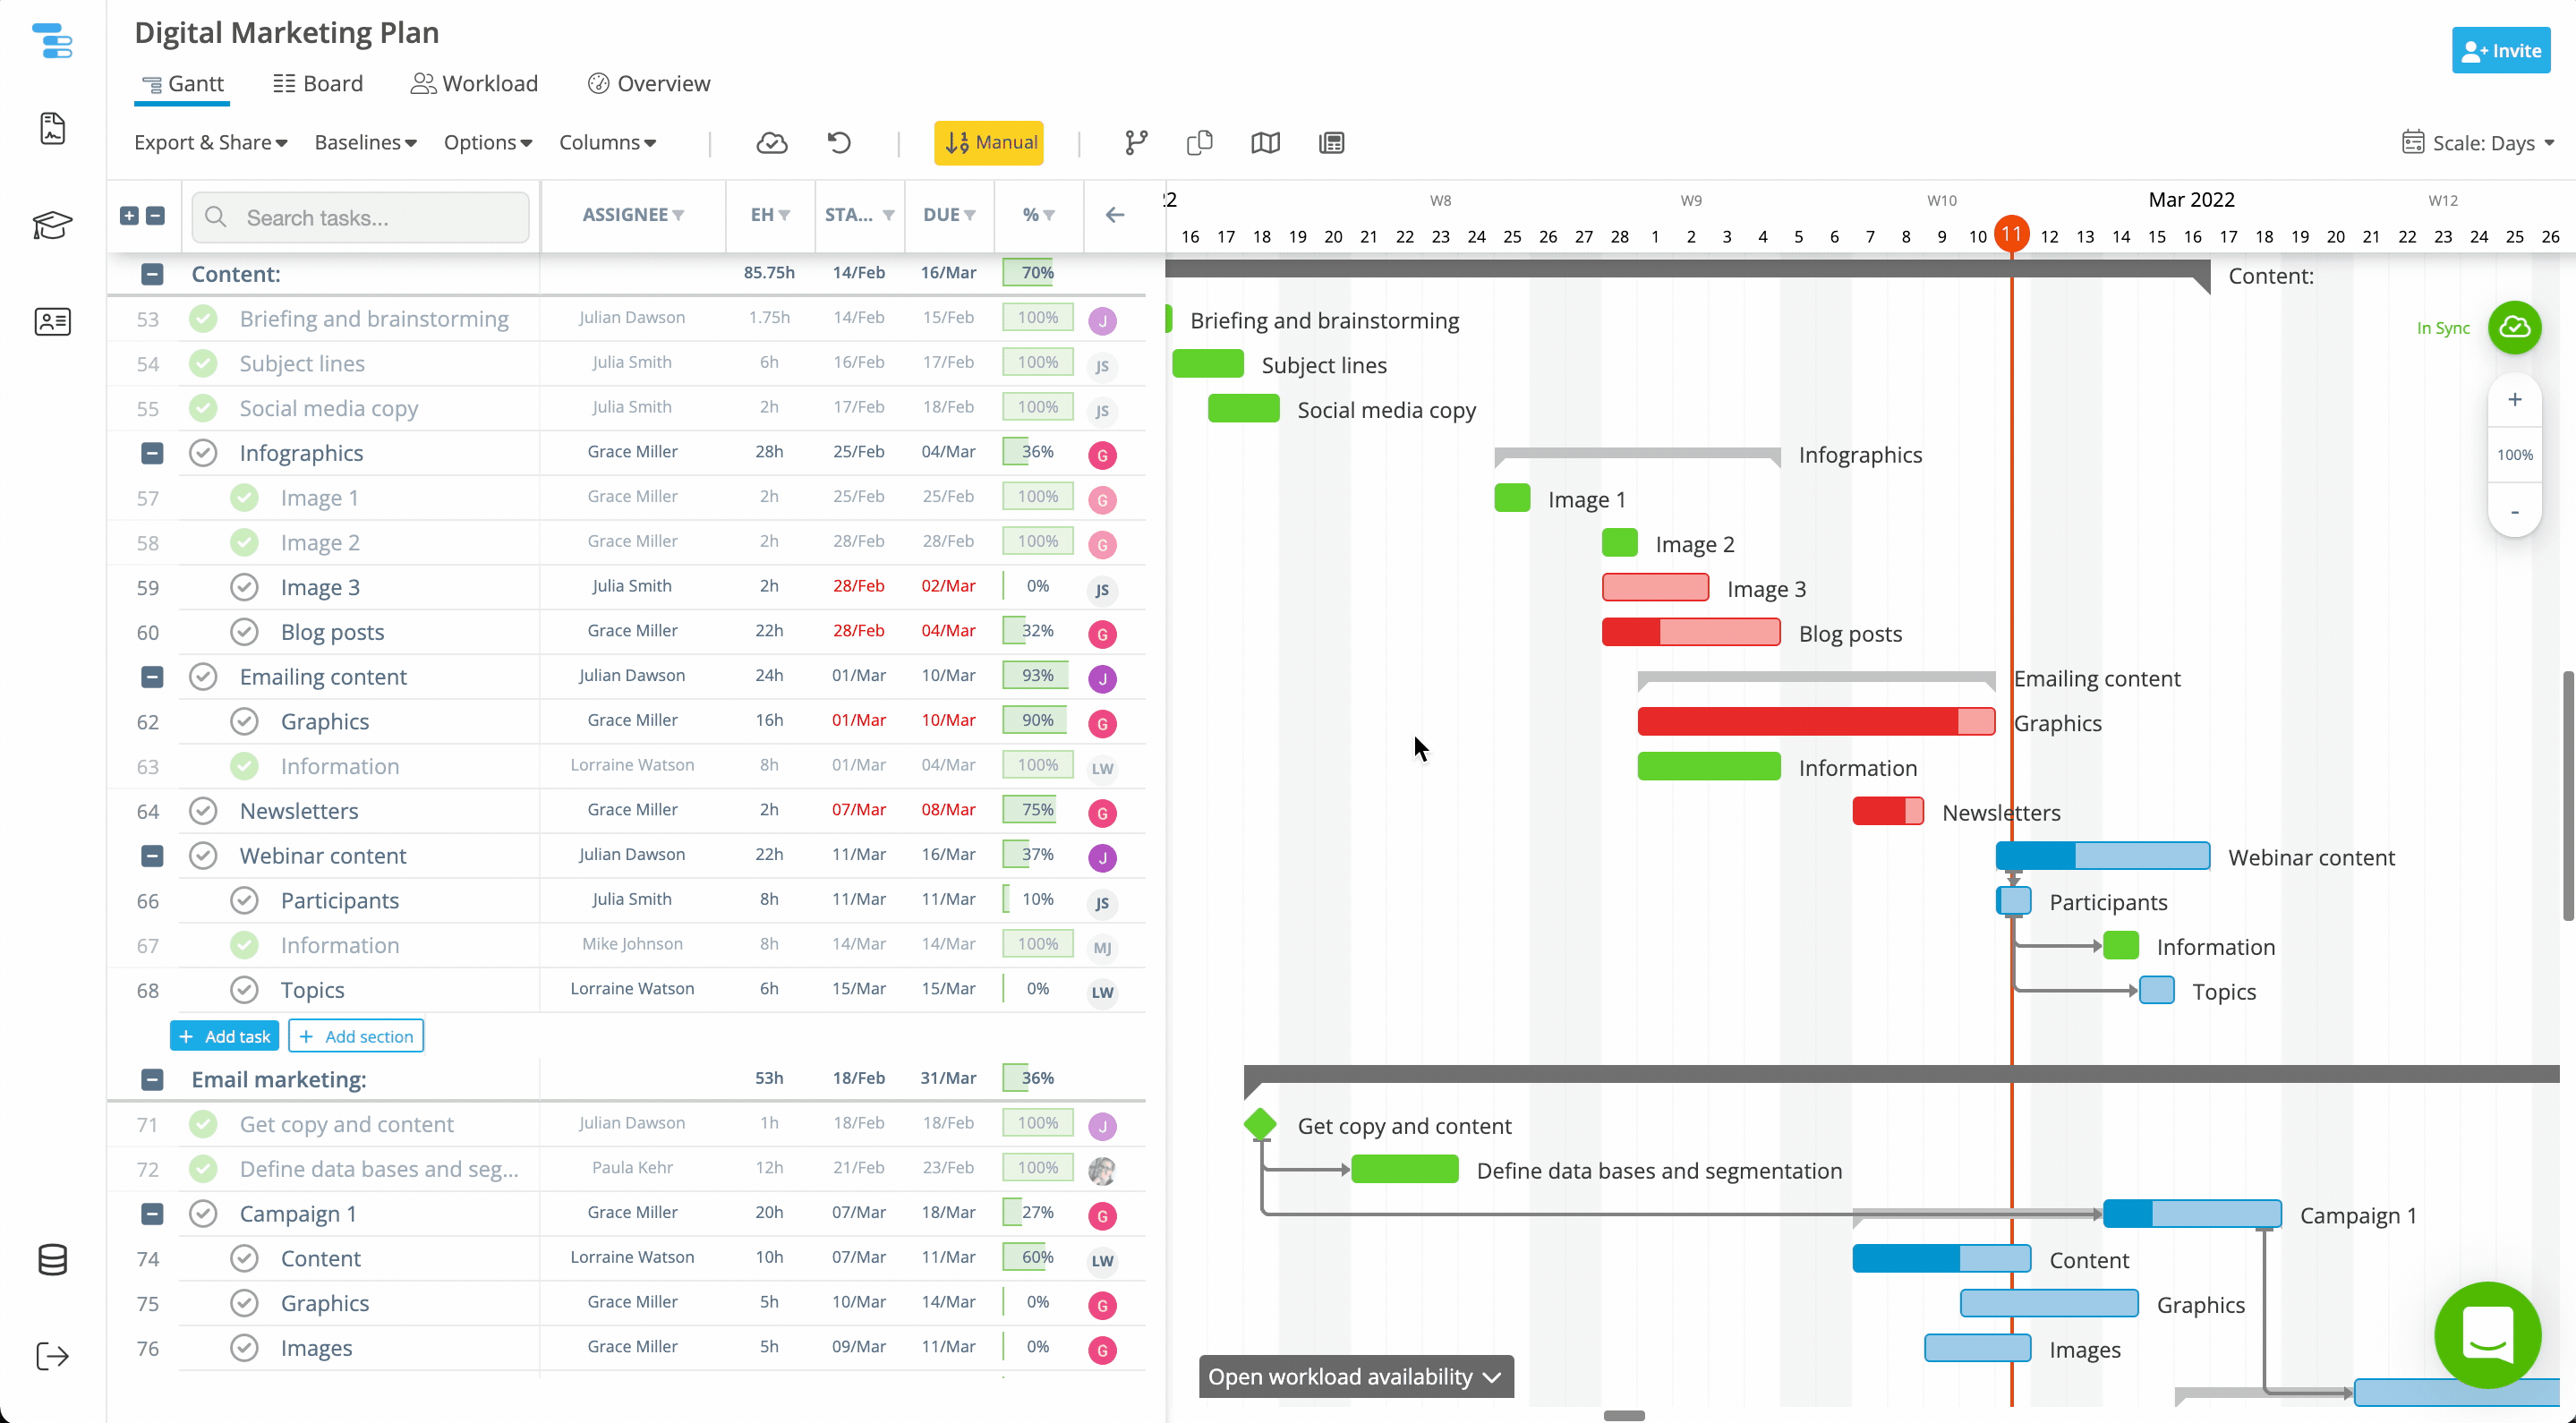
In addition to the standalone Workload View, Instagantt also offers a Team Workload panel within the Gantt chart. When scheduling tasks, you can click the "Open workload availability" button at the bottom of the Gantt interface to view a compact version of the workload distribution—without switching views.This allows you to:
- View each teammate’s available hours directly in the Gantt chart
- Schedule tasks more effectively, based on real-time availability
- Prevent overloads while planning timelines and dependencies
🛠 How It Works
-> Each team member is shown in their own lane, with their assigned tasks and corresponding workloads.-> The system calculates total workload by dividing the Estimated Hours by the task’s Duration, then aggregates that per day.-> A red number highlights any day a team member is overloaded, helping you rebalance workloads with ease.
Example: Workload View in Action
Example: Team Workload in Gantt View
🤝 Why Use Workload View in Instagantt?
By combining task management with real-time resource tracking, Workload View helps project managers make better decisions, faster. Whether you’re rescheduling tasks or planning ahead, Instagantt ensures your team stays productive, balanced, and on track.
💪 Ready to Balance Your Team’s Workload?
Use Instagantt’s Workload View to visualize assignments, plan resources efficiently, and stay aligned with your online Gantt chart.👉 Visit instagantt.com to plan smarter and keep your projects perfectly balanced.
❓Frequently Asked Questions (FAQ)
What’s the difference between Workload View and Gantt View in Instagantt?
Workload View focuses on showing team members' capacity and task distribution, while the Gantt chart visualizes timelines and dependencies. Workload View helps manage workloads, and the Gantt chart helps schedule and track tasks over time.
How is workload calculated in Instagantt?
Workload is calculated by dividing a task’s Estimated Hours by its Duration. These daily values are then summed per user to show their total workload per day.
How do I know if my team’s capacity is set correctly?
You can define each user’s daily working hours or capacity on the Options menu, by clicking "Working days". This ensures that the workload numbers reflect real capacity and make overload warnings accurate.
Can I export or share the Workload View?
The workload of a project can be exported as a spreadsheet. Just head over to the Export & Share menu, click Export as Spreadsheet and select the Workload tab to obtain a workload export.
The workload hours are not being correctly displayed, what should I do?
If the hours in Workload View are not visible, please zoom in the chart with the zoom option located on the right side of the screen. Sometimes a low zoom setting may affect the display of the workload hours due to the small size of the cell where they're meant to be displayed.