Progress
Understanding progress is essential for effective project management. In Gantt-based planning, progress helps teams understand how work is advancing compared to the original plan, identify delays early, and make informed decisions to keep projects on track.
Instagantt provides multiple ways to visualize and analyze progress, combining task‑level completion with high‑level indicators. This approach strengthens planning, tracking, and forecasting within modern project scheduling and Gantt-based environments.
🧭 Table of Contents
- What Is Progress in Project Management?
- How Progress Is Calculated in Instagantt
- Viewing Progress in the Gantt Chart
- Progress Overview and the Progress Graph
- Using Progress in the Dashboard (Standalone Only)
- Summary
- Frequently Asked Questions (FAQ)
🧠 What Is Progress in Project Management?
In project management, progress represents how much of the planned work has been completed at any given time. Within a Gantt chart, progress connects task execution to the project timeline, making it easier to assess whether delivery is aligned with expectations.
Progress is especially valuable in gantt chart planning because it allows teams to:
- Compare actual execution against the plan
- Detect deviations early
- Adjust priorities, resources, or scope when needed
By visualizing progress directly in gantt chart software, teams gain clearer insight into both short‑term execution and long‑term delivery trends.
⚙️ How Progress Is Calculated in Instagantt
In Instagantt, progress is calculated at the task level and then aggregated upward to parent tasks, sections, and the overall project to provide accurate, multi‑level insights.
Progress considers:
- Fully completed tasks
- Partially completed tasks, based on their completion percentage
To ensure realistic reporting, Instagantt calculates progress as a weighted average based on task duration in working days. This means that longer tasks have a greater impact on overall progress than shorter ones, reflecting the true effort distribution across the project.
For parent tasks, sections, and the full project, progress is calculated automatically from their underlying tasks, ensuring consistency across all levels of the Gantt chart.
These values are automatically summarized to reflect overall progress for sections and for the entire project. This ensures that progress tracking remains consistent and reliable across your Gantt chart, supporting accurate reporting and decision‑making.
📊 Viewing Progress in the Gantt Chart
At the task level, progress is visible directly within the Gantt chart. Each task bar visually reflects its completion, making it easy to understand execution status at a glance.
Users can set or update task progress in two ways:
👉 By enabling the Progress column from the Columns menu. This allows users to enter any value between 0 and 100, giving full control over the exact completion percentage.
👉 By opening the Task Details Pane and adjusting progress from the Progress section. This method lets users set progress in 10% increments (10%, 20%, 30%, and so on), which is useful for quick, standardized updates.
This task‑level visibility and control support day‑to‑day planning by allowing teams to monitor individual task advancement, identify stalled or slow‑moving work, and maintain alignment between schedule and execution as work evolves.
📈 Progress Overview and the Progress Graph
In the Overview section, Instagantt displays a Progress Graph that provides a high‑level view of how the project is advancing over time.
The graph includes:
- An Estimated Progress curve, representing how the project should advance if the plan is followed exactly, calculated as a weighted average based on task duration in working days
- A Current Progress curve, reflecting actual execution based on task completion
Both curves are plotted with time on the X‑axis and progress on the Y‑axis, allowing teams to quickly compare planned versus actual performance.
Users can interact with the graph by hovering over it to view progress statistics for specific dates. Progress data is shown only for dates where tasks were completed or were planned to be completed.
Additionally, users can click the three‑dot menu in the top‑right corner of the progress graph to enable a Baseline curve. This curve reflects the selected historical baseline, showing how the project was expected to progress at the time the baseline was saved. Because baselines are historical snapshots, they usually differ from the current chart unless the baseline was created very recently, offering valuable context during gantt chart planning and change analysis.
Below the graph, Instagantt displays the overall project progress, which combines all fully and partially completed tasks into a single percentage.
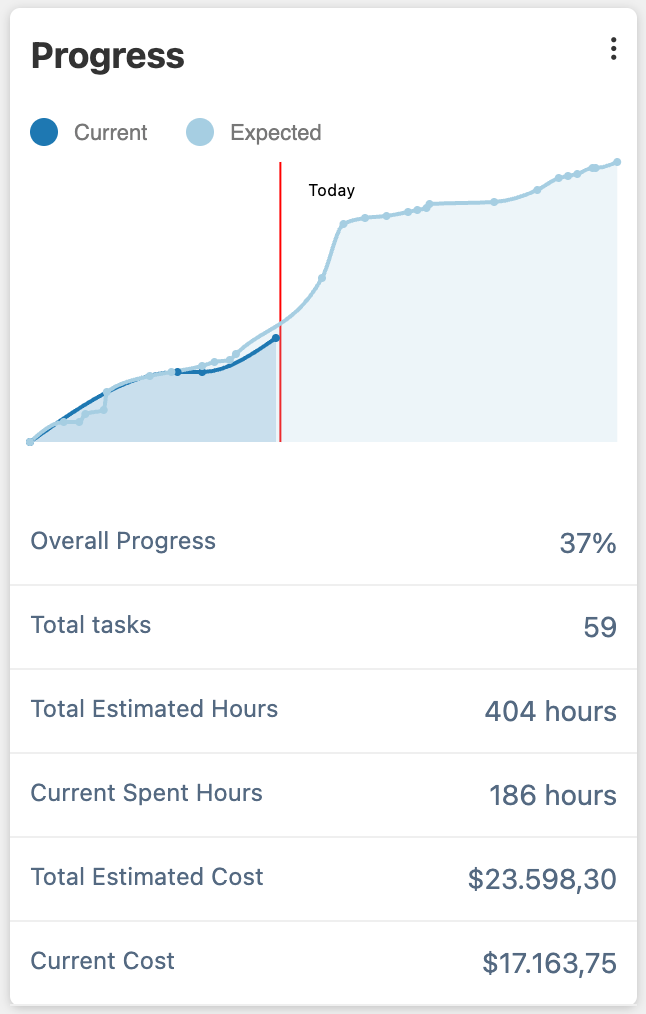
📊 Using Progress in the Dashboard (Standalone Only)
The Dashboard provides another way to analyze progress, focusing on comparison rather than timeline visualization. This view is only available in Instagantt Standalone.
In the Dashboard, progress is presented as stats, allowing teams to:
- Compare actual progress against expected progress
- Identify gaps between plan and execution
- Review performance across projects or sections
This side‑by‑side comparison supports higher‑level monitoring and is especially useful for portfolio‑level project management and reporting within gantt chart software.
📌 Summary
Progress tracking in Instagantt connects planning and execution by combining task‑level completion with powerful visual summaries. Through the Gantt chart, the Progress Graph, and the Dashboard, teams can clearly see how work is advancing compared to expectations.
By integrating progress into everyday gantt chart planning, Instagantt helps teams maintain control, adjust proactively, and deliver projects more reliably using modern gantt software and gantt chart software.
❓ Frequently Asked Questions (FAQ)
How is overall progress calculated?
Overall progress is calculated by combining all fully completed and partially completed tasks across the project.
What is the difference between estimated and current progress?
Estimated progress reflects how the project should advance if the plan is followed exactly, while current progress shows actual execution based on task completion.
What does the baseline curve represent?
The baseline curve shows expected progress based on the project’s baseline plan, helping teams compare current performance against original estimates.
Why don’t I see progress data for every date on the graph?
Progress data is only shown for dates where tasks were completed or were planned to be completed.
Is the Dashboard available in Instagantt for Asana?
No. The Dashboard is only available in Instagantt Standalone.
Can I sync progress from Asana to Instagantt?
No. Progress is a field that can't be synced between Asana and Instagantt, due to the differences in progress calculation between both software programs.